| Area | Jacoby Creek |
| Topic | Sediment: Turbidity & Discharge at Upper Jacoby Cr (UJC) 2004 |
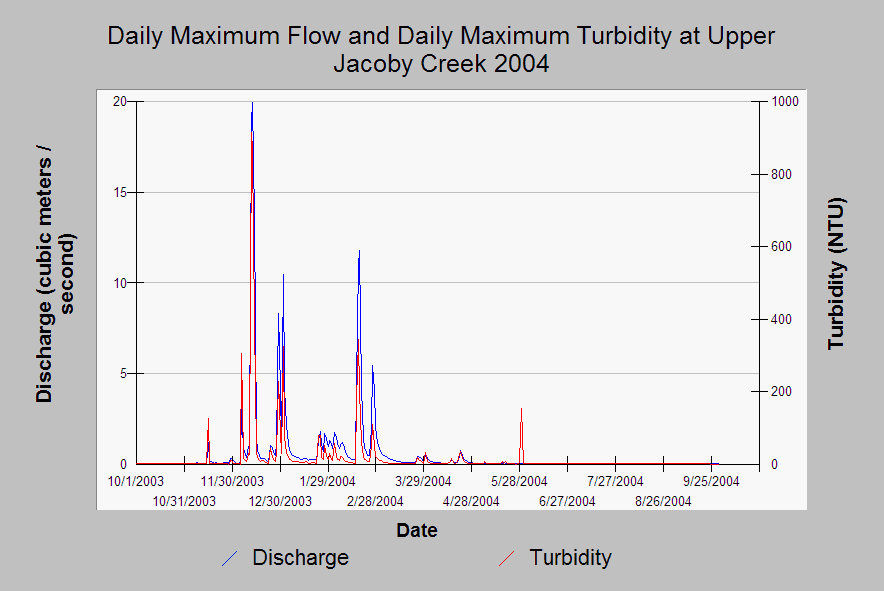
| Caption: This chart shows daily maximum flow (cubic meters per second) and daily maximum turbidity (NTU) for the turbidity threshold sampling station in upper Jacoby Creek (station UJC) for hydrologic year 2004. Redwood Science Lab collected and processed the data, including the corrected turbidity shown here. The source table contains data quality ratings for each data point. See Info Links for more information. | |
 |
To learn more about this topic click Info Links .
To view additional information (data source, aquisition date etc.) about this page, click Metadata .
To view the table with the chart's data, click Chart Table web page.
To download the table with the chart's data, click sed_turbflo_rsl_ujc_2004_dailystats.db (size 34,816 bytes)
To download the table with the chart's data as an Excel spreadsheet, click sed_turbflo_rsl_ujc_2004_dailystats.db.xls (size 69,816 bytes) .
| www.krisweb.com |
