| Bibliography | Background | Hypotheses | Home | |
![]()
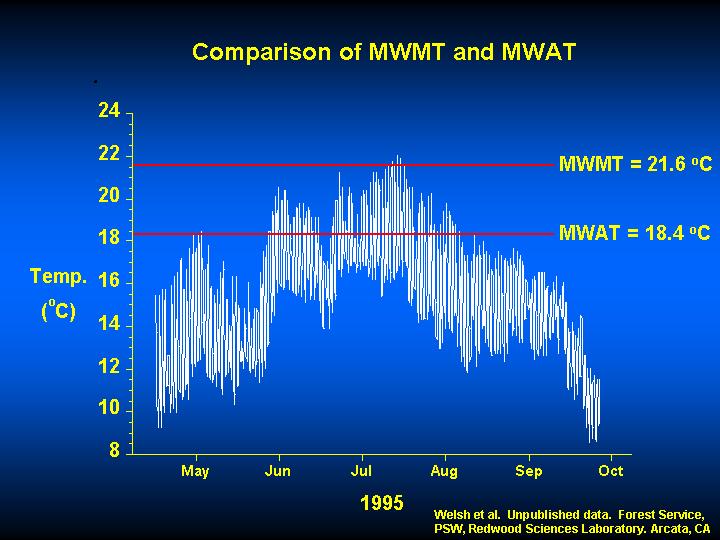
This chart shows the hourly water temperature of a Mattole River tributary. The average daily mean temperature for each seven-day period was calculated and the maximum value for the year (MWAT) of 18.4o C is displayed. The average daily maximum temperatures for each seven-day period was also calculated and the maximum for the season (MWMT) attained 21.6 o C. Data and graphic from Dr. Hartwell Welsh and Garth Hodgson, Redwood Sciences Lab, Arcata, CA.
![]()
|
Table of Contents for Background Pages |
|||||
| Stream Conditions: | Water Quality | Sediment | Riparian | Big Wood | Habitat Types |
| Watershed Conditions: | Vegetation Types | Slope Stability | Roads & Erosion | Cumulative Impacts | Urbanization |
| Fish & Aquatic Life: | Fish Populations | Amphibians | Aquatic Insects | Hatcheries | Fish Disease |
| Restoration: | Stream Clearance | In-stream Structures | Riparian | Watershed | Strategy |
| Geology / Hydrology: | Geology | Soils | Precipitation | Stream Flow | Channel Processes |
| Policy & Regulation | ESA | TMDL | Forest Rules | 1603 Permits | Water Rights |
| www.krisweb.com |