| Bibliography | Background | Hypotheses | Home | |
![]()
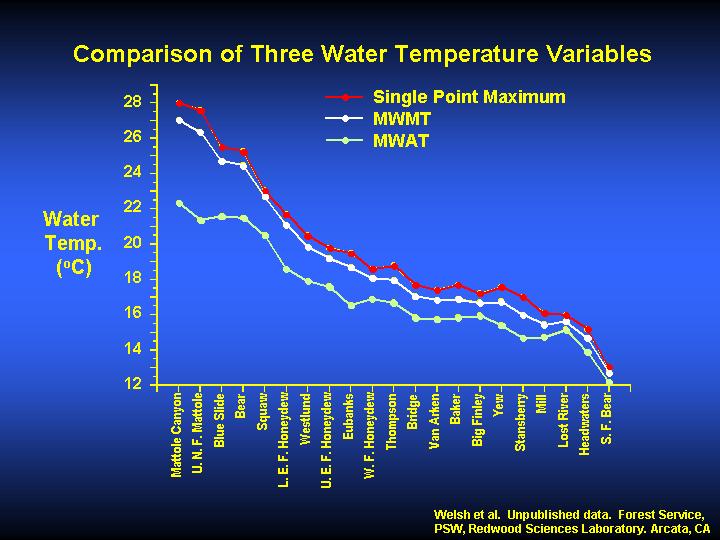
This chart shows the comparison between maximum daily water temperature, maximum floating weekly maximum (MWMT) and maximum floating weekly average temperatures based on field data from the Mattole River. The maximum of the floating weekly average (MWAT) can underestimate maximum temperatures by as much as 5o C in warmer streams because the greater daily amplitude in these streams can pull the daily average down considerably. This modifying affect using MWAT makes the MWMT (maximum floating weekly average) a more biologically meaningful parameter that will better predict the ability of a given water body to support cold-water adapted species such as coho salmon or tailed frogs (Welsh & Hodgson, personal communication).
Data and information from Dr. Hartwell Welsh and Garth Hodgson, Redwood Sciences Lab, Arcata, CA.
![]()
|
Table of Contents for Background Pages |
|||||
| Stream Conditions: | Water Quality | Sediment | Riparian | Big Wood | Habitat Types |
| Watershed Conditions: | Vegetation Types | Slope Stability | Roads & Erosion | Cumulative Impacts | Urbanization |
| Fish & Aquatic Life: | Fish Populations | Amphibians | Aquatic Insects | Hatcheries | Fish Disease |
| Restoration: | Stream Clearance | In-stream Structures | Riparian | Watershed | Strategy |
| Geology / Hydrology: | Geology | Soils | Precipitation | Stream Flow | Channel Processes |
| Policy & Regulation | ESA | TMDL | Forest Rules | 1603 Permits | Water Rights |
| www.krisweb.com |