| Area | S Marin/Redwood Creek |
| Topic | WQ: Copper Concentrations in Redwood Creek 1994 & 1995 |
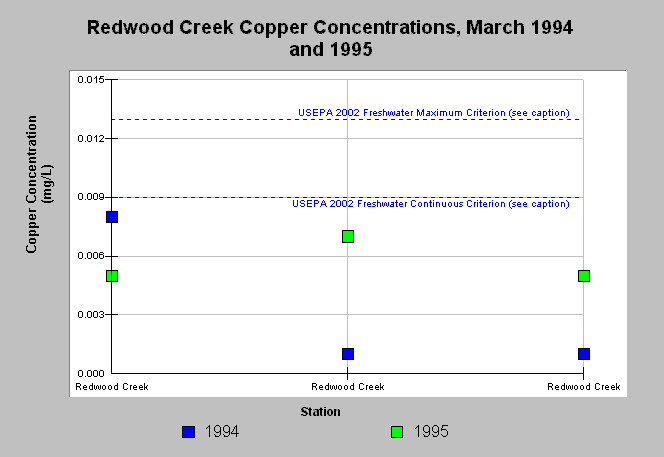
| Caption: This graph shows one-time sampling measurements of copper in Redwood Creek at three stations during March 1994 and 1995. Data were collected by the University of San Francisco (USF) for the Golden Gate National Recreation Area. The reference values are the U.S. Environmental Protection Agency (USEPA) Freshwater Critical Maximum Concentration (13 µg/L) and Critical Continuous Concentration (9 µg/L) (USEPA, 2002). Note the equivalent saltwater criteria are 4.8 and 3.1 µg/L, respectively. The freshwater criteria are expressed as a function of hardness and since hardness was not measured a value of 100 mg/L was assumed. Note that these measurements do not represent a 24-hour average, but only a one time measurement. See Picture tab for a map of the sampling sites. | |
 |
To learn more about this topic click Info Links .
To view additional information (data source, aquisition date etc.) about this page, click Metadata .
To view the table with the chart's data, click Chart Table web page.
To download the table with the chart's data, click wq_elementssum_redwood_usf_goga_1994_1995.dbf (size 524 bytes) .
To view the table with the chart's source data, click Source Table web page.
To download the table with the chart's source data, click wq_elements_redwood_usf_goga_1994_1995.dbf (size 2,552 bytes)
| www.krisweb.com |
