| Area | Salmon Creek |
| Topic | WQ: PH in Salmon Creek 2001 |
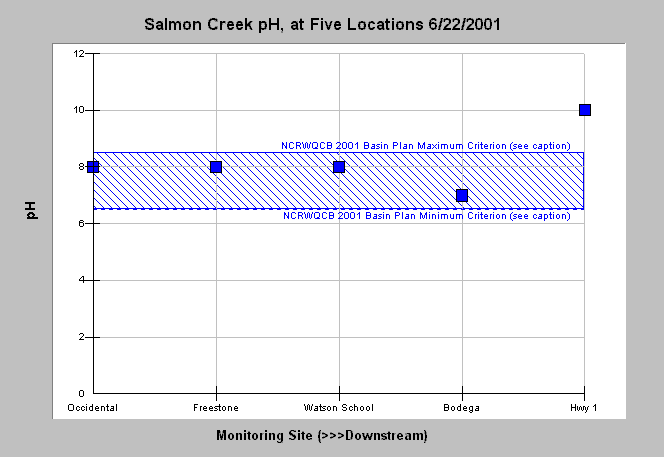
| Caption: This graph shows one-time sampling measurements of pH at five stations (going downstream from left to right) in Salmon Creek on June 22, 2001. The very high pH of 10 at Highway 1 is likely related to an algae bloom and may trigger conversion of any ammonia present to the un-ionized form, which can be highly toxic to fish. The reference values represent the North Coast Regional Water Quality Control Board (NCRWQCB) 2001 Basin Plan pH range objective of 6.5-8.5 (CRWQCB, 2001). These data were collected by the North Coast Regional Water Quality Control Board as a part of the Surface Water Ambient Monitoring Program (SWAMP). See Info Links for more information. | |
 |
To learn more about this topic click Info Links .
To view additional information (data source, aquisition date etc.) about this page, click Metadata .
To view the table with the chart's data, click Chart Table web page.
To download the table with the chart's data, click wq_salmon_ncrwqcb_2001.dbf (size 1,179 bytes) .
To view the table with the chart's source data, click Source Table web page.
To download the table with the chart's source data, click wq_russianandsalmon_ncrwqcb_2001.dbf (size 4,018 bytes)
| www.krisweb.com |
