| Area | Walker Creek |
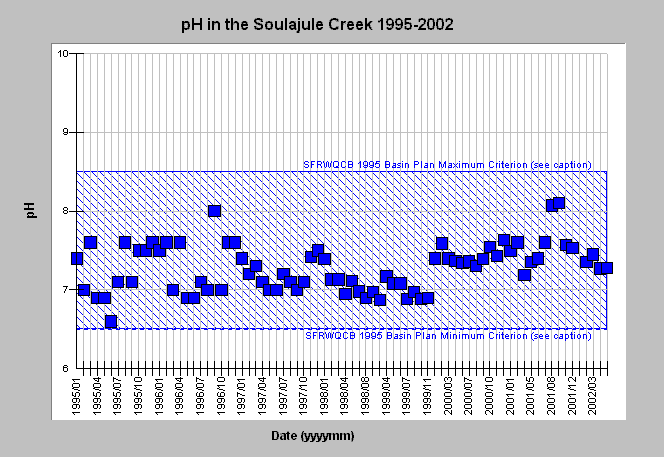
| Topic | WQ: PH in Soulajule Creek 1995-2002 |
| Caption: This graph shows pH measured approximately monthly in Soulajule Creek from 1995-2002. All values represent one-time sampling per month, except for a few values which represent the average of two samples taken that month (See Source Table). The reference values represent the San Francisco Bay Regional Water Quality Control Plan (SFRWQCB) 1995 Basin Plan pH range objective of 6.5-8.5 (CRWQCB, 1995). Data were collected by Marin Municipal Water District. See Info Links for more information. | |
 |
To learn more about this topic click Info Links .
To view additional information (data source, aquisition date etc.) about this page, click Metadata .
To view the table with the chart's data, click Chart Table web page.
To download the table with the chart's data, click wq_mmwd_ph_1995_2002.xls.db (size 6,144 bytes) .
To view the table with the chart's source data, click Source Table web page.
To download the table with the chart's source data, click wq_mmwd_all_1995_2002.xls.db (size 49,152 bytes)
| www.krisweb.com |
