| Area | Lower Klamath/Basin-wide |
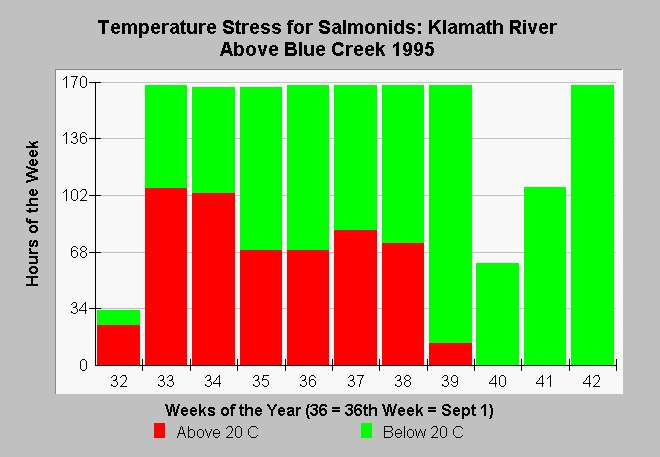
| Topic | Temperature: Fish Stress Klamath River at Blue Creek in 1995 |
| Caption: The Chart above shows the number of hours in the week that Klamath River water temperatures exceeded stressful for salmonids (>20 C) during late summer in 1995 at Blue Creek. The automated temperature sensing device was not deployed until the first week in August (32 = 32nd week). Temperature stress for salmonids is derived from McCullough (1999) who noted that growth for all species ceased above that temperature. Data collected by U.S. Fish and Wildlife Service Arcata Field Office. See Info Links for more information. | |
 |
To learn more about this topic click Info Links .
To view additional information (data source, aquisition date etc.) about this page, click Metadata .
To view the table with the chart's data, click Chart Table web page.
To download the table with the chart's data, click bluestr.dbf (size 1,045 bytes) .
To view the table with the chart's source data, click Source Table web page.
To download the table with the chart's source data, click bluecoon.dbf (size 696,868 bytes)
| www.krisweb.com |
