
| Area | Mainstem Klamath |
| Topic | Temperature: Min, Max, Avg Klamath River at Iron Gate 2001 |
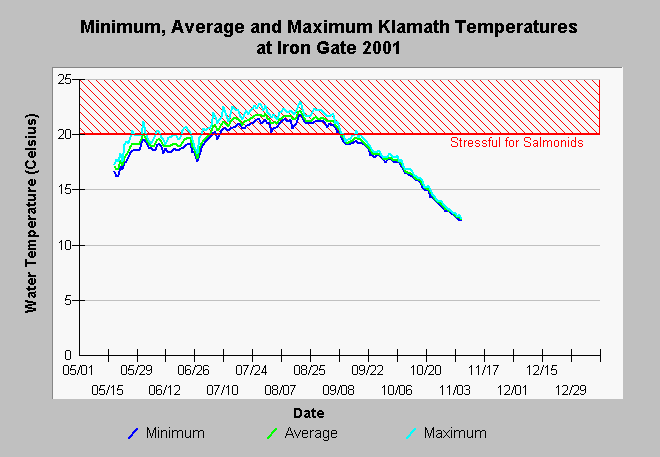
| Caption: This chart shows minimum, average, and maximum daily water temperature for the Klamath River at the Iron Gate Bridge for the period 05/19/2001 to 11/6/2001. Maximum daily river temperatures exceeded stressful levels from late-May through mid-September. Data are from the US Fish and Wildlife Service. See Info Links for more information. | |
 |
To learn more about this topic click Info Links .
To view additional information (data source, aquisition date etc.) about this page, click Metadata .
To view the table with the chart's data, click Chart Table web page.
To download the table with the chart's data, click temp_klam_trin_usfws_2001_2002_daily_mma.db (size 374,784 bytes) .
To view the table with the chart's source data, click Source Table web page.
To download the table with the chart's source data, click tempraw_klam_trin_usfws_2001_2003.db (size 9,275,392 bytes)
| www.krisweb.com |