| Area | S.F. Trinity |
| Topic | Coliform (Fecal): Hayfork Creek at Six Sites 1994-1995 |
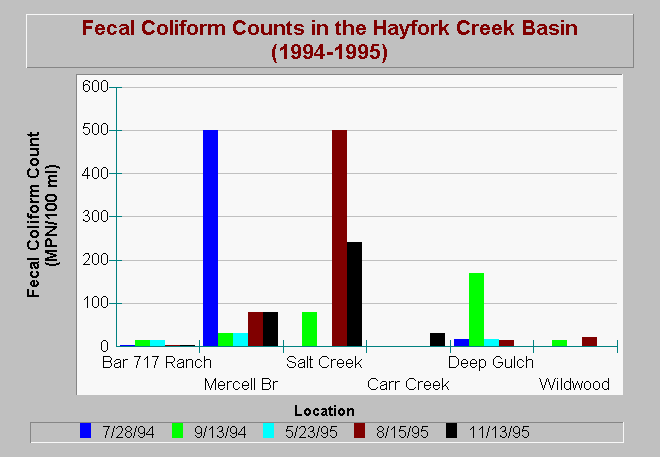
| Caption: Fecal coliform was calculated from water samples collected in Hayfork Creek at several locations and in lower Salt Creek by the Trinity County Resource Conservation District (RCD) on five dates in 1994 and 1995. Values are shown as most probable number (MPN) of fecal coliform per 100 milliliters (ml) of water. Highest values of fecal coliform were detected at Mercell Bridge in July 1994 and in lower Salt Creek in August 1995. Samples were analyzed by Basic Laboratories in Redding, California. Click on Info Links for more information. | |
 |
To learn more about this topic click Info Links .
To view additional information (data source, aquisition date etc.) about this page, click Metadata .
To view the table with the chart's data, click Chart Table web page.
To download the table with the chart's data, click hyfecoli.dbf (size 916 bytes) .
| www.krisweb.com |
