
| Area | Greenwood Creek |
| Topic | Temperature: FWA at Greenwood Creek and tributaries 2001 |
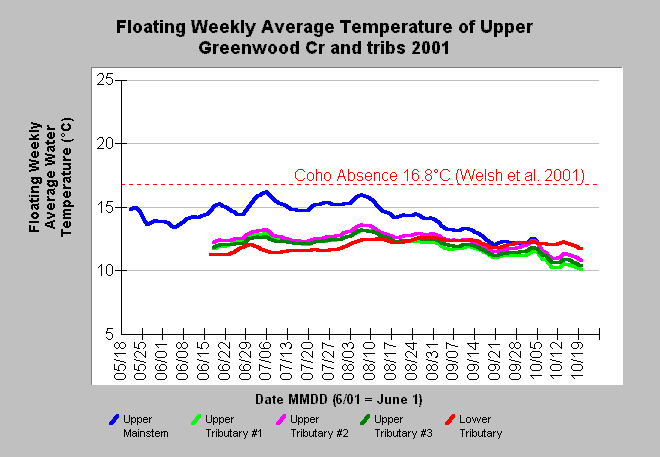
| Caption: The chart shows the floating weekly average water temperature in Celsius (°C) at upper Greenwood Creek (Site 84-3) and several small tributaries (Sites 84-22, 84-21, 84-23, 84-20) for the year 2001. Maximum floating weekly average water temperatures did not exceed 16.8°C at any site in 2001. The mainstem of Greenwood Creek was 3.0 - 4.0 °C warmer than the tributaries during warm periods. Welsh et al. (2001) found that coho are not likely to persist where maximum floating weekly average temperature (MWAT) exceeds 16.8°C. See Info Links for more information. Temperature data provided by the Mendocino Redwood Company. | |
 |
To learn more about this topic click Info Links .
To view additional information (data source, aquisition date etc.) about this page, click Metadata .
To view the table with the chart's data, click Chart Table web page.
To download the table with the chart's data, click temp_greenwd_daily.db (size 102,400 bytes) .
To view the table with the chart's source data, click Source Table web page.
To download the table with the chart's source data, click greenwood_temps.dbf (size 711,044 bytes)
| www.krisweb.com |