| Area | Mainstem |
| Topic | Sediment: Gravel Permeability for Flume Gulch 1999 |
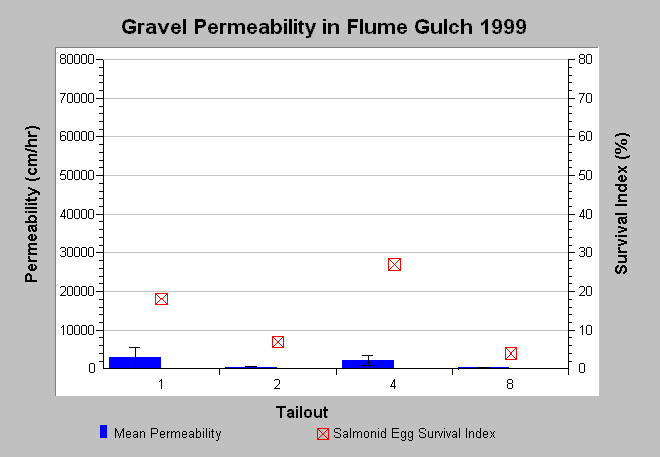
| Caption: This chart displays gravel permeability from Flume Gulch in 1999. Mean gravel permeability is shown for sampled tailouts (pool-riffle transitions) with whiskers representing standard error. Permeabilities are low here compared to mainstem Navarro values (see next Topic). Salmonid egg survival index is plotted on the right y-axis and is based on data from Tagart (1976) and McCuddin (1977). Data provided by Mendocino Redwood Company. See Info Links for more information. | |
 |
To learn more about this topic click Info Links .
To view additional information (data source, aquisition date etc.) about this page, click Metadata .
To view the table with the chart's data, click Chart Table web page.
To download the table with the chart's data, click perm_flume_99.db (size 4,096 bytes) .
To view the table with the chart's source data, click Source Table web page.
To download the table with the chart's source data, click perm_allsites_mrc.dbf (size 18,018 bytes)
| www.krisweb.com |
