| Area | Rancheria Creek |
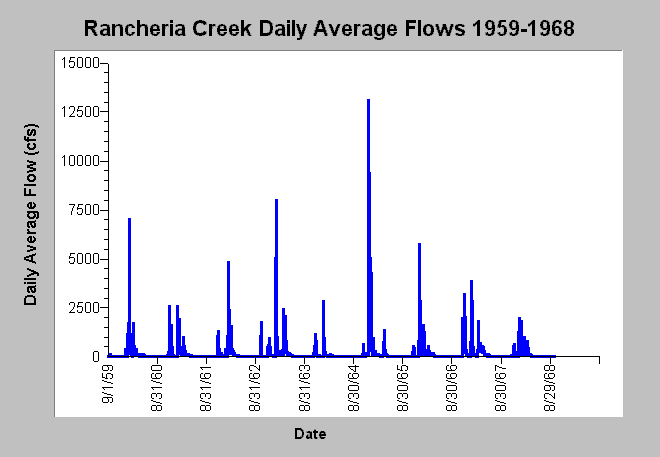
| Topic | Flow: Rancheria Creek - Daily Average, 1959-1968 |
| Caption: This chart displays daily average flows (cfs) for Rancheria Creek for the water years 1959-1968. The data are from the US Geological Survey. The peak daily average flow of 13,100 cfs occurred on 12/22/1964. See Info Links for more information. | |
 |
To learn more about this topic click Info Links .
To view additional information (data source, aquisition date etc.) about this page, click Metadata .
To view the table with the chart's data, click Chart Table web page.
To download the table with the chart's data, click ranch_flow.dbf (size 116,292 bytes) .
| www.krisweb.com |
