
|

|
| Background | Hypotheses | Bibliography | Maps | Home |
|
|
|
| Background | Hypotheses | Bibliography | Maps | Home |
Timber Harvest Information in KRIS Ten Mile
KRIS Web Background Pages: Vegetation Types
![]()
The 1994 Landsat imagery, processed by the U.S. Forest Service Southwest Region Remote Sensing Lab, is available in the KRIS Ten Mile Map project. Landsat imagery for most other areas of the State is also available (Warbington et al., 1998; Schwind, 1999). These data allow a quick review of seral stages in various Calwater planning units. The USFS classification system, which uses ten size classes, but not tree type, was chosen. Tree size was then used as a surrogate for seral stage. Timber harvest data from the California Department of Forestry CDF is also incorporated into KRIS Ten Mile Maps. These can be used in conjunction with the USFS vegetation classification to explore watershed disturbance.
Watersheds with lower disturbance levels are more likely to have a diverse assemblage of salmonid species (Reeves et al., 1993). Reeves et al. (1993) found in Oregon coastal watersheds where timber harvest exceeded 25%, streams had lost salmonid species diversity and tended to be dominated by one salmonid species. The Non-Forest, Sapling (1-4.9") and Small Tree (5-12") components often represent logging. If these components comprise more than 30% of the vegetation and timber types, then cumulative effects risks in a watershed should be considered during watershed assessment.
The Fire and Resource Assessment Program (FRAP) of CDF has recently completed a project that shows the changes in the landscape between 1994 and 1998, based on Landsat data that compares those years (Fisher, 2001). This process, called change scene detection, is very useful in KRIS Map projects because it helps update vegetation coverages based on 1994 imagery.
 |
This image, from the KRIS Ten Mile Map project, shows USFS vegetation coverage derived from 1994 Landsat imagery for the entire Ten Mile River Basin. Much of the South Fork Ten Mile landscape is characterized as early seral stands with Non-Forest (grass/shrubs/bare soil) and Saplings (trees 2-4.9" diameter) due to recent logging. Large Non-Forest components in the east and west are natural due to grasslands and sand dunes, respectively. Much of the central portion of the watershed has substantial components of Small-Medium (12-19.9") and Medium/Large trees (20-29.9") interspersed with patches of Small Trees (5-11.9") indicating a more mature forest than in the South Fork. |
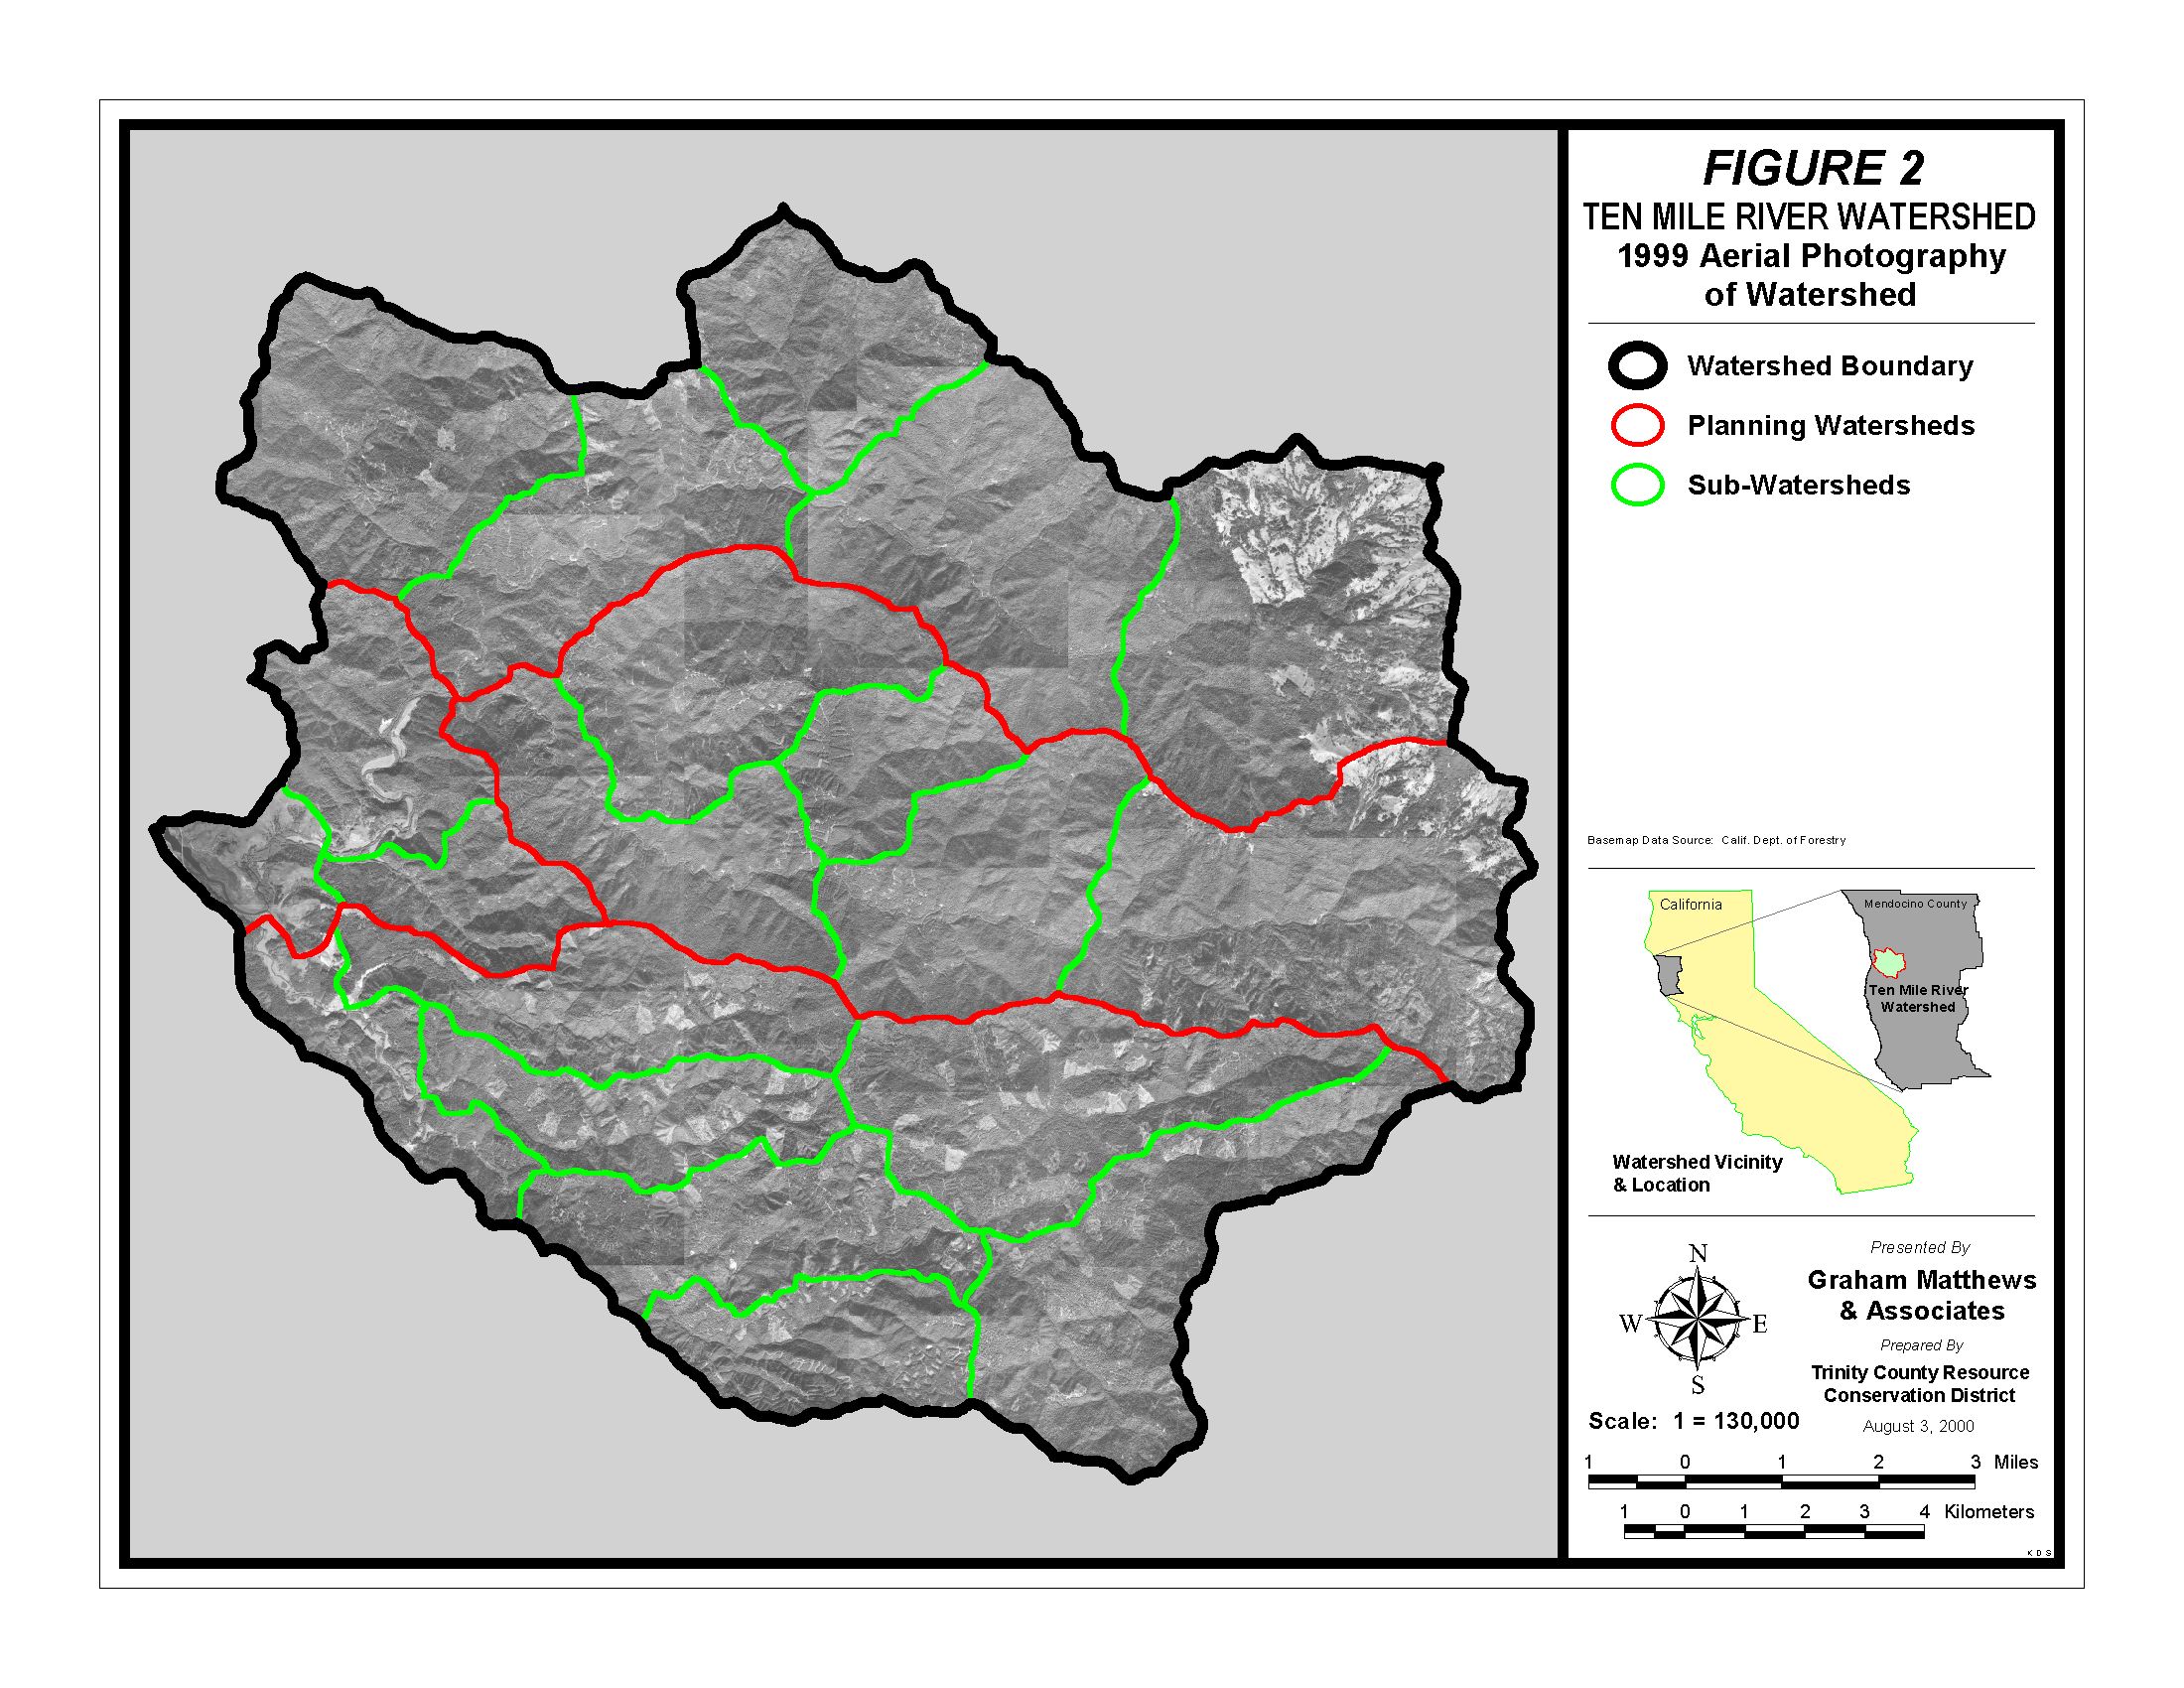 |
The image at left, Figure 2 from Matthews (2000), shows an aerial photograph of the Ten Mile River watershed in 1999. This mosaic of photos is used as a backdrop in the KRIS Ten Mile Map project, providing another tool for assessing vegetative conditions. The tiled aerial mosaic is not ortho-corrected and the slight difference in shading is due to photos being taken at different times. |
 |
The image at left shows the Ten Mile River basin as a 1999 aerial photo mosaic along with change scene detection showing how vegetation changed between 1994 and 1998. Places in green colors had substantial vegetation growth while those in orange and reds indicate reduction of vegetation The aerial photos were assembled by Matthews (2000) and the change scene detection is from CDFG FRAP. Image is from KRIS Ten Mile Map project. |
|
This bar chart from the KRIS Ten Mile database shows vegetation and timber types in the Patsy Creek Calwater planning watershed, which covers the upper North Fork Ten Mile River basin. The information was derived from a 1994 Landsat image by the U.S. Forest Service. The Patsy Creek Calwater has a much different signature than most other North Fork Ten Mile watersheds because it has extensive, natural grasslands in upland areas. These are partly linked to underlying bedrock geology and are likely indicative of interior belt Franciscan Formation. |
|
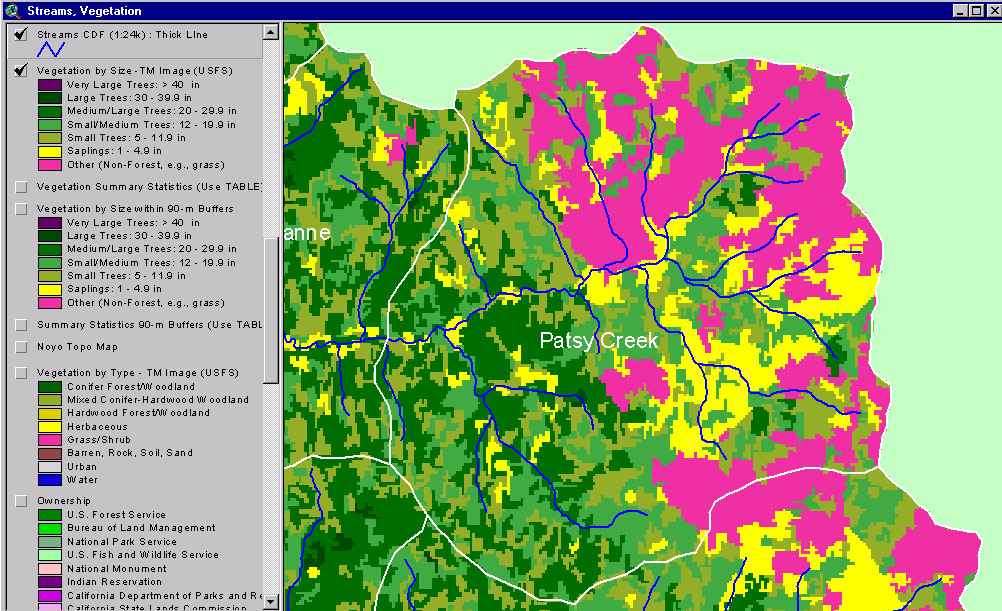
This image from the KRIS Ten Mile River Map project shows USFS vegetation and stand types for the Patsy Creek (NF Ten Mile River) Calwater planning watershed, derived from a 1994 Landsat. Much of the area to the east is natural grasslands intermixed with oak woodlands, which gives this view a substantial component in Non-Forest and Sapling signatures. |
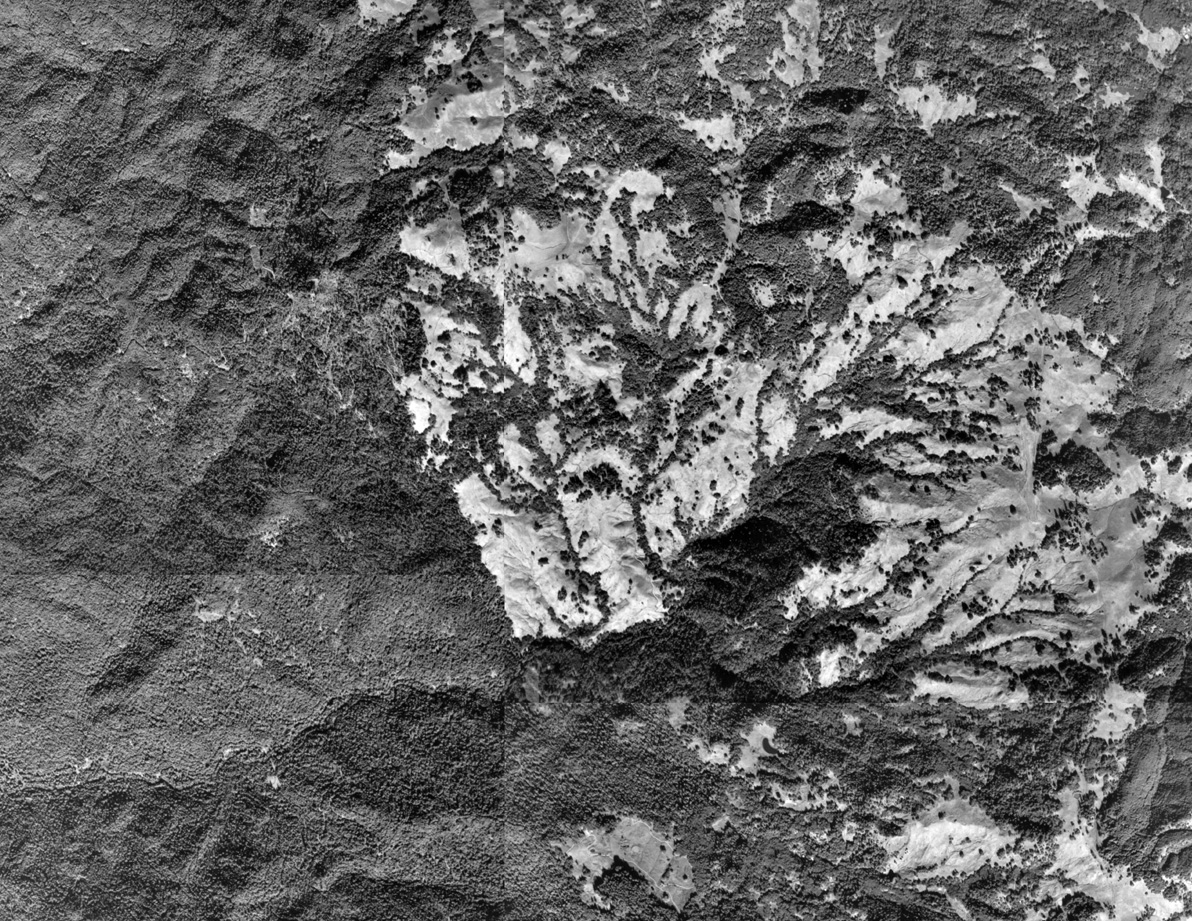 |
This 1999 aerial photo of the Patsy Creek Calwater shows the upper North Fork Ten Mile River watershed. The photo was provided by Matthews and Associates (2001). The change in contrast across the image the result of joining aerial photos with different shading. Grasslands, which dominate much of this Calwater, are partially due to weak bedrock geology and earth flow activity. |
 |
In the Bear Haven Calwater planning watershed, in the Middle Fork Ten Mile River basin, has the most mature forest, according to vegetation and timber types. The information was derived from a 1994 Landsat image by the U.S. Forest Service. The Bear Haven watershed was comprised of 41% Medium-Large Trees (20-29"), 23% Small-Medium Trees (12-19.9") and 2% Large Trees (30-39.9"). The remaining 21% of the watershed was trees smaller than twelve inches, Chart from the KRIS Ten Mile database. |
 |
This image from the KRIS Ten Mile River Map project shows USFS vegetation and stand types for the Booth Gulch Calwater planning watershed, derived from a 1994 Landsat. The scale of accuracy for stands is one hectare. This planning watershed is dominated by Medium-Large Trees (20-29.9") but has substantial components of smaller tree sizes as well (6-20" diameter). There is no Non-Forest components and there are only small patches of Saplings (1-4.9"). |
 |
This bar chart shows vegetation and timber types of the Churchman Creek Calwater planning watershed, which covers the southern, middle area of the South Fork Ten Mile River watershed. The information was derived from a 1994 Landsat image by the U.S. Forest Service. The Churchman Creek Calwater was dominated by Medium-Large trees (20-30" diameter) with 36% cover, while Large Trees (30-40") constituted only 3%. Small-Medium trees (12-19.9") made up the next largest group (23%). The Small Tree (5-11.9"), Sapling (1-4.9" diameter) and Non-Forest components indicate that 37% of the landscape in this Calwater is in very early seral stage conditions. |
 |
This map layout, created for the KRIS Ten Mile Map ArcView project, shows timber harvest by year in the Churchman Calwater planning unit. The backdrop is vegetation and timber size classes from the USFS. This image indicates that the vegetation pattern shown in the chart above has changed substantially since 1994. Matthews (2000) indicated that Churchman was 66% logged between 1988 and 1999. |
![]()
References
Matthews, Graham and Associates. 2000a. Sediment source analysis and preliminary sediment budget for the Ten Mile River, Mendocino County, CA. Prepared for Tetra Tech, Inc. VOLUME 1: Text, Tables, and Figures. Fairfax, VA. 143 pp.
Matthews, Graham and Associates. 2000b. Sediment source analysis and preliminary sediment budget for the Ten Mile River, Mendocino County, CA. Prepared for Tetra Tech, Inc. VOLUME 2: Appendices. Fairfax, VA. 59 pp.
Reeves, G.H., F.H. Everest and J.R. Sedell. 1993 . Diversity of Juvenile Anadromous Salmonid Assemblages in Coastal Oregon Basins with Different Levels of Timber Harvest. Transactions of the American Fisheries Society. Vol 122, No. 3. May 1993.
Schwind, B. 1999. USFS Thematic Mapper Landsat Vegetation Coverage Background Information. USDA Forest Service. Pacific Southwest Region Remote Sensing Lab. Sacramento, CA.
Warbington, R., B. Schwind, C. Curlis and S. Daniel. 1998. Creating a Consistent and Standardized Vegetation Database for Northwest Forest Plan Monitoring in California. USDA Forest Service. Pacific Southwest Region Remote Sensing Lab. Sacramento, CA.
![]()
| www.krisweb.com |