 |
 |
| Background | Hypotheses | Bibliography | Maps | Home |
|
|
| Background | Hypotheses | Bibliography | Maps | Home |
KRIS Web Background Pages: Modeling Shallow Landslides
![]()
Note: Geologic information, electronic maps and models within the KRIS Gualala project are meant to provide background information only and not as a decision making tool. California requires that licensed geologists be involved directly in decisions related to geologic conditions (see requirement). The California Geologic Survey has reservations regarding the content of KRIS Gualala (see comment note), including slope stability maps, and their endorsement of the contents of this page is not implied.
![]()
Examples below are from the KRIS Gualala Map project and show the basin relief, slope steepness and a SHALSTAB Model run. The latter was prepared in 3D Analyst by Dr. Jan Derksen of the KRIS IFR team based on the methods of Dietrich (1998). Dietrich (1998) requests users of the SHALSTAB model to employ the standard soil parameters he developed in his 1998 validation study to facilitate uniform results. He proposes tentatively a "high hazard" classification for scores equal to or below -2.8. produced by SHALSTAB with standard soil parameters and 10 meter digital elevation data. Ten meter elevation data on which the model was run were provided by the California Department of Forestry Fire and Resource Assessment Program. To avoid the necessity of extensions for Arc View, SHALSTAB run and slope are carried in the KRIS Gualala Map project as images. No actual landslide mapping data from the Gualala River basin were ever made available to the KRIS team so that predicted and actual landslides could be compared (see note on data sharing).
 |
At left
is a Gualala River basin elevation map in meters with an elevation grid
of 1000 by 1400 cells. Each cell contains an individual elevation value
for a10x10 meter location on the ground. The various elevations are
grouped together by color. This map is used to compute steepness and wetness.
The highest elevations in the basin are along the eastern and northern boundaries.
|
 |
The map
image at left shows an artificial 3D landscape with an overlay showing slope
steepness, both constructed from the 10 meter DEM. Slope steepness is greatest
in the Gualala River basin. The steepest slopes are located in the North
Fork, Rockpile, parts of Buckeye Creek and the eastern Wheatfield. Steep
slopes occur in relatively few locations in the South Fork.
|
 |
The map
image at left shows landslide hazards for the Gualala River basin. Areas
of highest risk have low, negative scores (orange/red color codes). The
highest risk slopes are concentrated in the North Fork Gualala River watershed,
although slopes are also susceptible to debris sliding in much of Rockpile,
parts of Buckeye Creek and the central and eastern Wheatfield. Inner gorge
locations also show high risk of debris slides such as area along the South
Fork and lower Wheatfield.
|
 |
The image
at left shows a three dimensional model of the upper Rockpile Creek, showing
landslide risks simulated using 10 meter DEMs and running the SHALSTAB model
according to Dietrich et al. (1999). Slope shown in yellow is moderate
instability (values 2.5-2.8) with higher instability (>2.8) shown
in red. The eastern Gualala basin, including upper Rockpile Creek, is underlain
by Central Belt Franciscan terrain. Debris slide risk is actually lower
in proximity to large earthflows which tend to slide to lower angles of
repose. The SHALSTAB results displayed in KRIS Gualala Maps are for informational
purposes only and should not be used as the only tool in assessing slope
instability. The latter task is that of a licensed
engineering geologist. Model run by Jan Derksen in Arc View 3D Analyst.
|
 |
The map at left shows the SHALSTAB model run for Fuller Creek in the Wheatfield Fork basin. Fuller shows high risk in headwall areas and along the inner gorge. Plateaus in the western part of the basin have lower slide risk. |
 |
The SHALSTAB
model output for the Middle SF Gualala Calwater and Haupt Creek shows a
much more stable landscape than the North Fork Gualala, Rockpile Creek or
Fuller Creek. Ohlsen Ranch Formation terraces are stable land forms
showing along the east side, but inner gorges are unstable both along the
South Fork and in tributaries to the east in the Haupt Creek basin. The
South Fork follows the San Andreas Fault and can experience uplift and periodic
seismic shaking, which influences landslide risk.
|
|
|
|
|
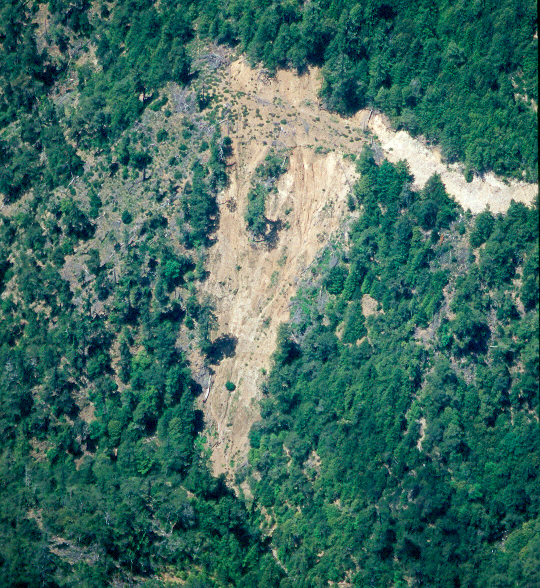
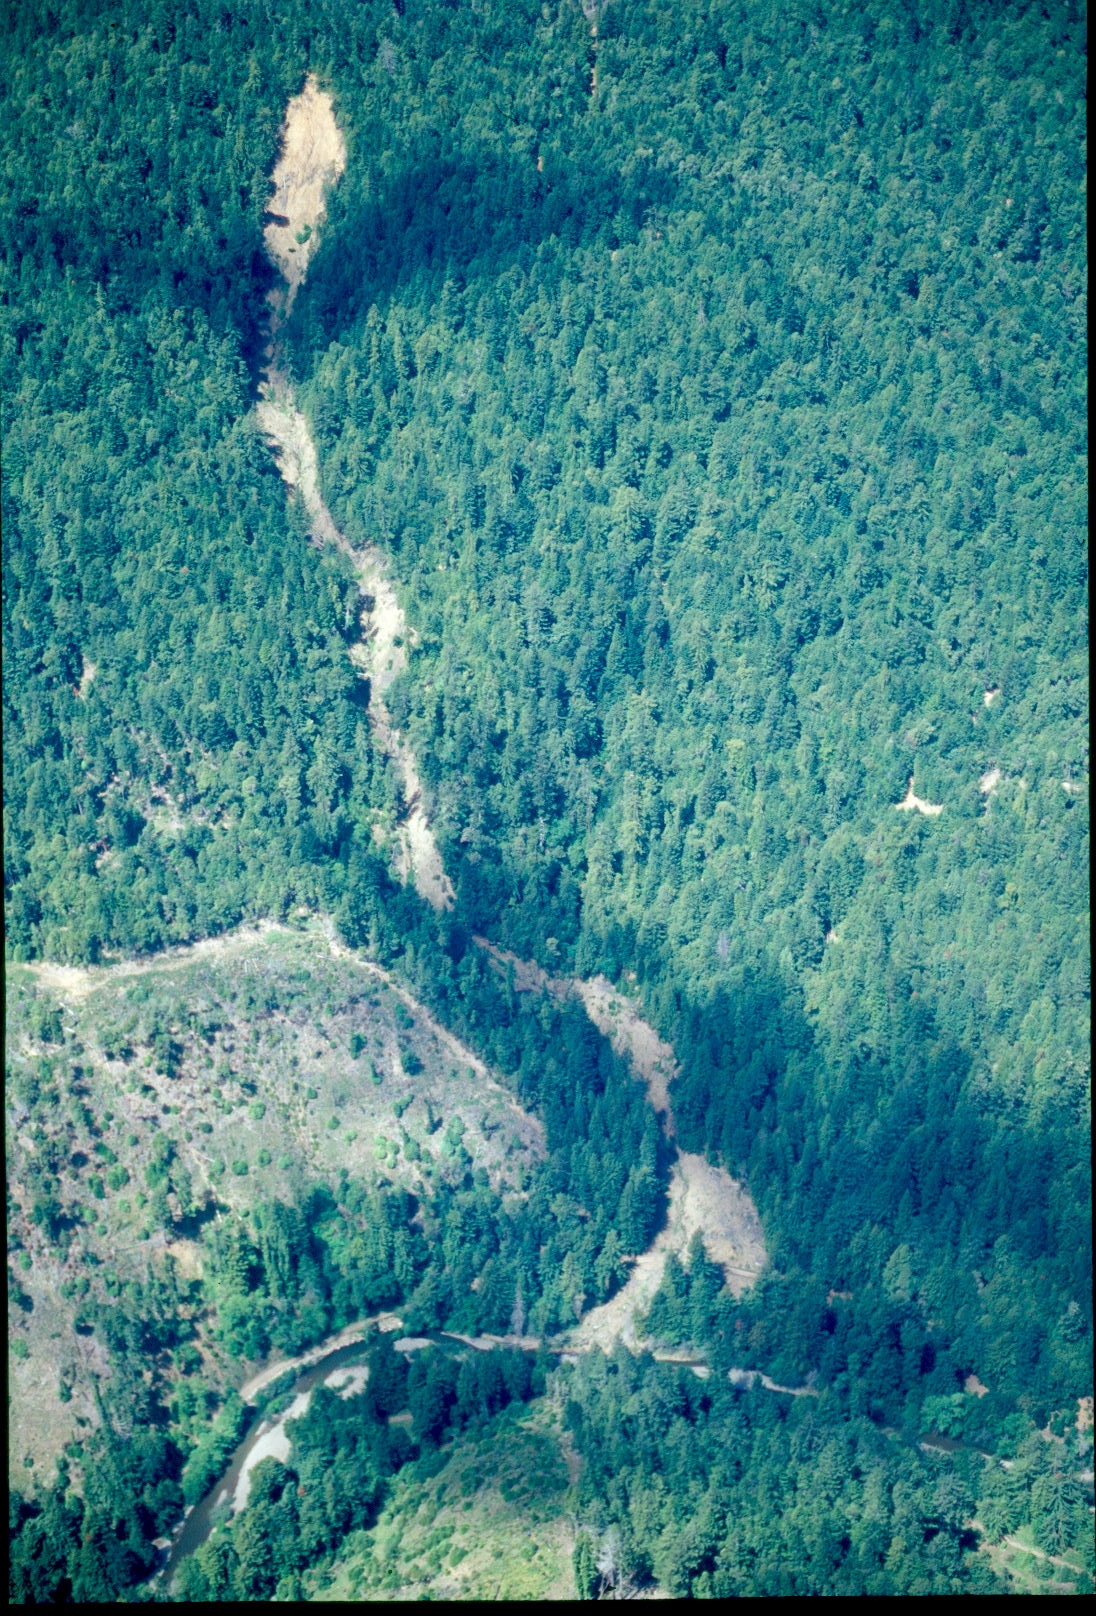
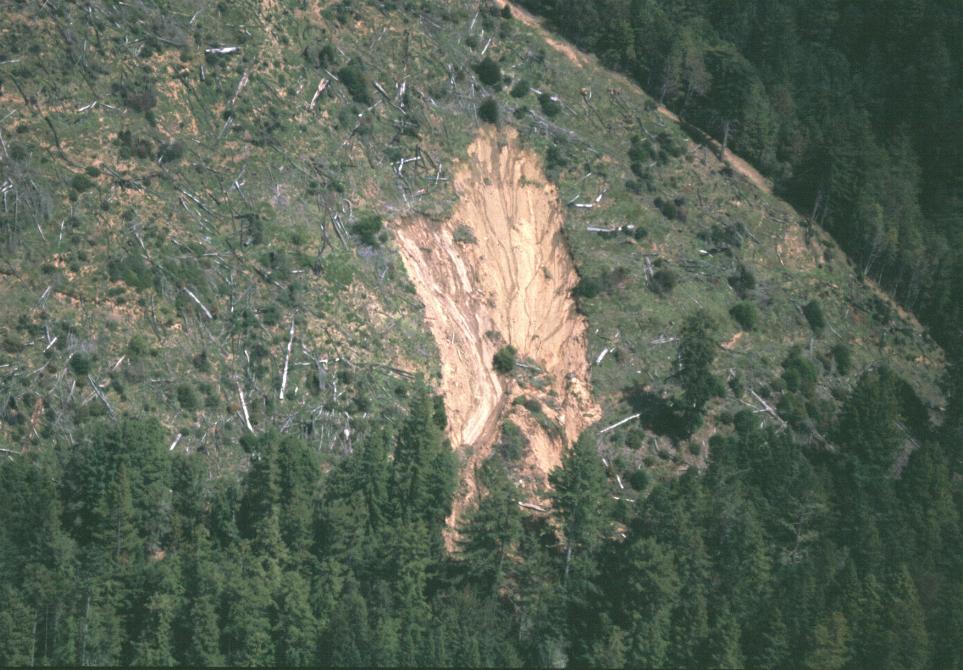
| The image above shows a large slide associated with a landing. Over burdening the hillslope with the soil mass needed for log decking set the stage for a large slope failure. Steep slopes right above a watercourse are known as an "inner gorge" location. Picture provided by Brian McFadden, North Coast Regional Water Quality Control Board. | This photo shows the path of a debris torrent traveling from a mid-slope position directly to a Gualala River tributary. This failure does not appear connected to any recent land use. Picture provided by Brian McFadden, North Coast Regional Water Quality Control Board. | Aerial view of clear-cut unit on lower Buckeye Creek, below Little Creek along Beatty Ridge just to the east of the lower SF Gualala. Large slope failure inside timber harvest area low on a slope may be delivering sediment to the watercourse below. It is also possible that the sediment was stopped by the riparian buffer. Photo courtesy of RRRAUL. |
![]()
References
Dietrich, W.E. et al. 1998. A validation study of the shallow slope stability model, SHALSTAB, in forested lands of Northern California. Stillwater Ecosystem, Watershed & Riverine Sciences. Berkeley, CA. 59 pp.
Sterling, Stephen. 2002. California Geologic Survey review comments on KRIS Gualala. In a letter to Patrick Higgins, Institute for Fisheries Resources, Arcata, CA. Dated 3/15/02. 3 p.
![]()
| www.krisweb.com |