| Area | Walker Creek |
| Topic | Temperature: Maximum Temperatures in Walker Creek 2002 |
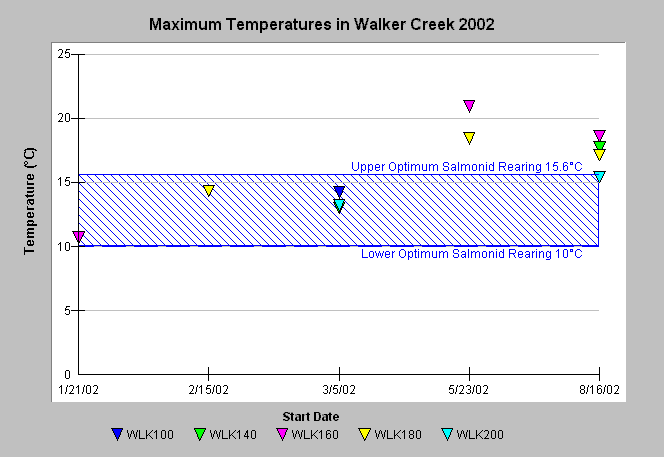
| Caption: This graph shows maximum temperatures measured in Walker Creek at various sites and during several monitoring periods in 2002. Measurements were taken at 15-minute intervals during deployment periods lasting from 4 to 15 days (See Source Table). The x-axis represents the start date of monitoring and the abbreviations in the legend are sampling station IDs. Temperatures in the May and August sampling periods were generally above the optimal range for salmonid rearing, however all average temperatures (see previous topic) were within the optimal range. The reference value of 10-15.6°C optimum temperature range for juvenile salmonid rearing is based on McCullough (1999). Data were collected by the San Francisco Bay Regional Water Quality Control Board as a part of the Surface Water Ambient Monitoring Program (SWAMP). See Map for sampling locations and Info Links for more information. | |
 |
To learn more about this topic click Info Links .
To view additional information (data source, aquisition date etc.) about this page, click Metadata .
To view the table with the chart's data, click Chart Table web page.
To download the table with the chart's data, click wq_rwqcb2_basicswamp_wlktempmax_2001.xls.db (size 4,096 bytes) .
To view the table with the chart's source data, click Source Table web page.
To download the table with the chart's source data, click wq_rwqcb2_basicswamp_lagwlk_2001.xls.db (size 8,192 bytes)
| www.krisweb.com |
