| Area | Lower Klamath/Basin-wide |
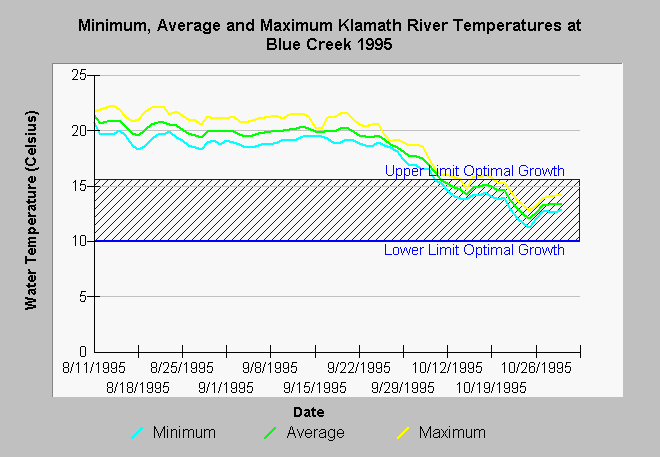
| Topic | Temperature: Min, Max, Avg Klamath River at Blue Creek 1995 |
| Caption: The minimum, average and maximum temperature of the Klamath River at Blue Creek for 1995 is displayed above. Maximum water temperatures exceeded stressful for salmonids for some period every day from early August through late September and even minimum night time temperatures did not fall back into the optimal range for salmonid growth (McCullough, 1999). Data provided by USFWS, Arcata. See Info Links for more information.. | |
 |
To learn more about this topic click Info Links .
To view additional information (data source, aquisition date etc.) about this page, click Metadata .
To view the table with the chart's data, click Chart Table web page.
To download the table with the chart's data, click bluetem3.dbf (size 6,302 bytes) .
To view the table with the chart's source data, click Source Table web page.
To download the table with the chart's source data, click bluecoon.dbf (size 696,868 bytes)
| www.krisweb.com |
