| Area | Lower Trinity/Basin-wide |
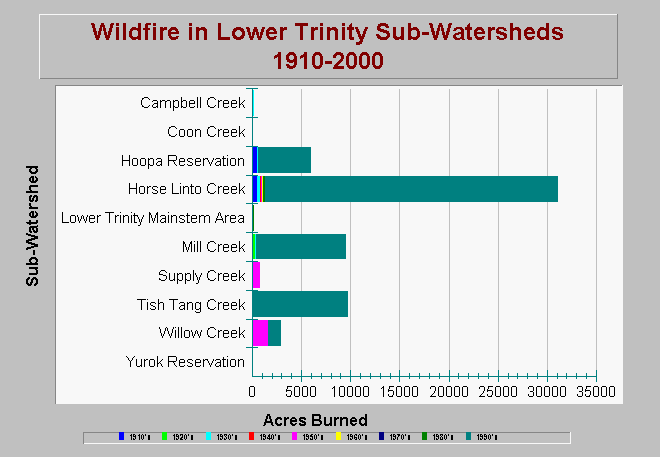
| Topic | Wildfire: Historical Wildfires - Lower Trinity 1910-2000 |
| Caption: This chart shows the total area (acres) burned in wildfires by decade in each sub-watershed within the Lower Trinity Planning Watershed. The different colored bars represent the acres burned per decade, while the total length of the bars show the total area burned during the period of 1910 to 2000. Wildfire in the 1990's burned more area in most sub-watersheds than any other decade. See Info Links for more information. | |
 |
To learn more about this topic click Info Links .
To view additional information (data source, aquisition date etc.) about this page, click Metadata .
To view the table with the chart's data, click Chart Table web page.
To download the table with the chart's data, click fire_acres_lowertrinity_gma_1910_2000.dbf (size 2,094 bytes) .
To view the table with the chart's source data, click Source Table web page.
To download the table with the chart's source data, click fire_acres_trinity_gma_1910_2000.dbf (size 11,732 bytes)
| www.krisweb.com |
