| Area | Mainstem Trinity |
| Topic | Flow: Trinity @ Lewiston Exceedance Curve |
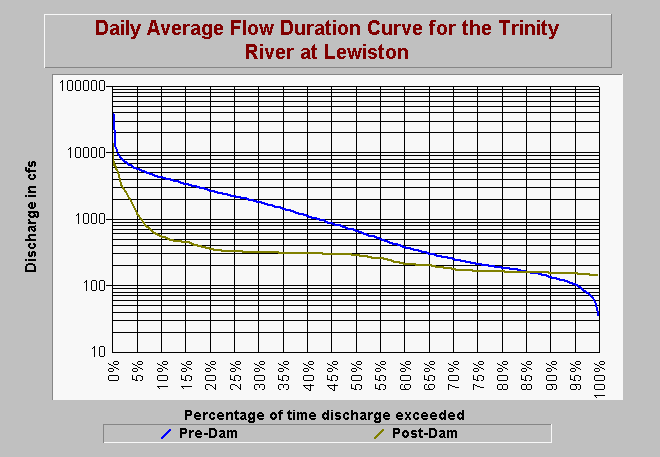
| Caption: This flow duration curve is derived from work by McBain and Trush and shows the patterns of flow in the Trinity River at Lewiston before and after construction of Trinity and Lewiston Dams. The curve shows that before the dam was built that flows were over 1000 cubic feet per second more than 40% of the time but after construction flows exceeded 1000 cfs just over 5% of the time. | |
 |
To learn more about this topic click Info Links .
To view additional information (data source, aquisition date etc.) about this page, click Metadata .
To view the table with the chart's data, click Chart Table web page.
To download the table with the chart's data, click fdclew.dbf (size 11,820 bytes) .
| www.krisweb.com |
