| Area | Scott River |
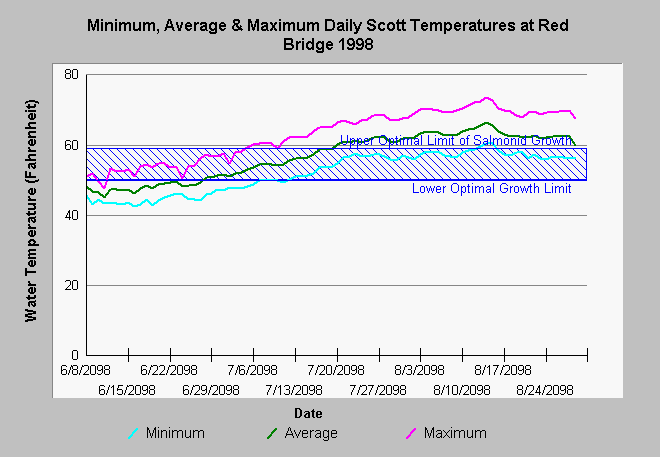
| Topic | Temperature: 1998 Min/Max/Ave Scott @ Red Bridge |
| Caption: This Chart Shows the daily maximum, average and minimum water temperatures on the Scott River at Red Bridge near Callahan. Data were to be collected from mid-June to mid-October using Hobotemp data recorders. However, the unit was found to be out of water after August 29th. Maximum water temperatures exceeded stressful for salmonids in August at this site, but minimums recovered to non-stressful at least for some period on most days. Data provided by the Siskiyou Resource Conservation District. See Info Links for more information. | |
 |
To learn more about this topic click Info Links .
To view additional information (data source, aquisition date etc.) about this page, click Metadata .
To view the table with the chart's data, click Chart Table web page.
To download the table with the chart's data, click rdbr98.dbf (size 5,889 bytes) .
To view the table with the chart's source data, click Source Table web page.
To download the table with the chart's source data, click rsc58-08.dbf (size 138,523 bytes)
| www.krisweb.com |
