| Area | S.F. Trinity |
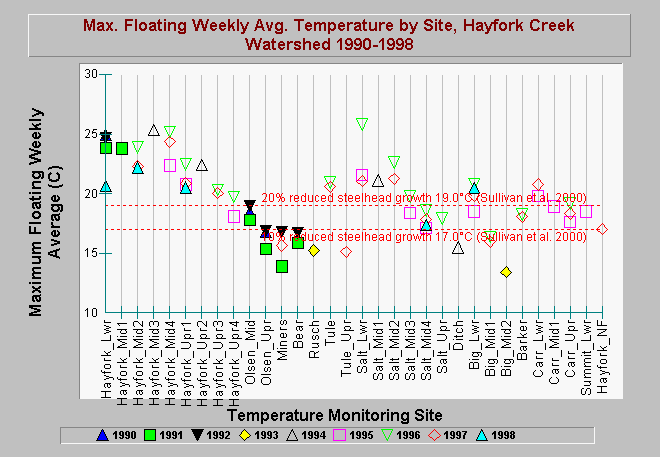
| Topic | Temperature: MWAT at Many Hayfork Sites, by Year 1990-1998 |
| Caption: This Chart shows maximum floating weekly average temperature (MWAT) for each site in the Hayfork Creek watershed with available data in the years 1990-1998. Sites are grouped by stream and are listed in upstream order. Based on a review of steelhead growth studies, Sullivan et al. (2000) found that compared to optimum temperatures, an MWAT of 17.0°C reduced steelhead growth by 10%, and an MWAT of 19.0°C reduced growth by 20%. See Info Links for more information. Data were provided by the Institute for Forest and Watershed Management at Humboldt State University, which compiled a regional database from many sources. | |
 |
To learn more about this topic click Info Links .
To view additional information (data source, aquisition date etc.) about this page, click Metadata .
To view the table with the chart's data, click Chart Table web page.
To download the table with the chart's data, click temp_mwat_hayfork_ifwm_90_98.dbf (size 18,274 bytes) .
To view the table with the chart's source data, click Source Table web page.
To download the table with the chart's source data, click temperature_proxy.dbf (size 80 bytes)
| www.krisweb.com |
