| Area | Upper Klamath |
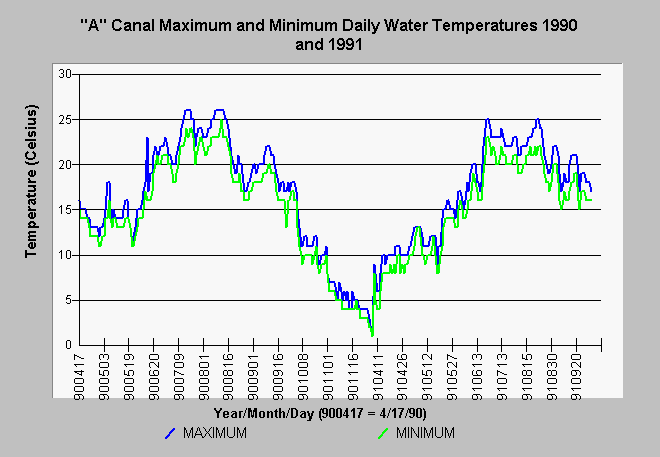
| Topic | Temperature: Min, Max A Canal 1990-1991 |
| Caption: The chart shows the maximum and minimum daily water temperature of the A Canal during 1990 and 1991. The temperature at the intake is representative of the out-flow of Upper Klamath Lake into Link River. The data summarized above was collected with a Hydrolab data probe deployed by the staff of the Bureau of Reclamation. Note that the device was deployed in mid-April each year and that maximum temperatures are similar in both years with peaks coming in July and August annually. The maximum water temperature in 1990 was 26 C while it was 25 C in 1991. See Info Links for more information. | |
 |
To learn more about this topic click Info Links .
To view additional information (data source, aquisition date etc.) about this page, click Metadata .
To view the table with the chart's data, click Chart Table web page.
To download the table with the chart's data, click acanal.dbf (size 156,022 bytes) .
| www.krisweb.com |
