Bibliography Background About KRIS
Hypothesis #5: The lower mainstem Garcia River is in recovery from sediment impacts.
Support for the Hypothesis
Several key Garcia River documents advance variations of this hypothesis: the Garcia River Watershed Enhancement Plan (Mendocino County Resource Conservation District, 1992), the Garcia River Sediment Total Maximum Daily Load report (U.S. EPA, 1998) and the Garcia River Gravel Management Plan (Phillip Williams Assoc., 1996). Evidence also comes from historical and recent photographs in the KRIS Garcia database.
The Garcia River watershed has a history of intensive timber harvest management that gave rise to elevated sediment transport, which has periodically effected the lower mainstem (MCRCD, 1992; U.S. EPA, 1998). The main stem Garcia River riparian zone was extensively logged between approximately 1870 and 1910 (Mangelsdorf, 1997), and the channel of the lower mainstem was still showing signs of aggradation in the earliest aerial photos in 1938 (MCRCD, 1992). California Department of Fish and Game (1966) identified catastrophic sediment yields related to post World War II logging (Figure 1), and such sediment would have cycled downstream with large floods and subsequent periods of high flow. Hagans and Higgins (1996) found evidence of such sediment transport by using aerial photos to measure changes in the width of the riparian zone of the lower North Fork Garcia River. The channel widened greatly between 1952 and 1966, which would have been consistent with a large pulse of sediment moving through the lower North Fork into the lower mainstem Garcia.
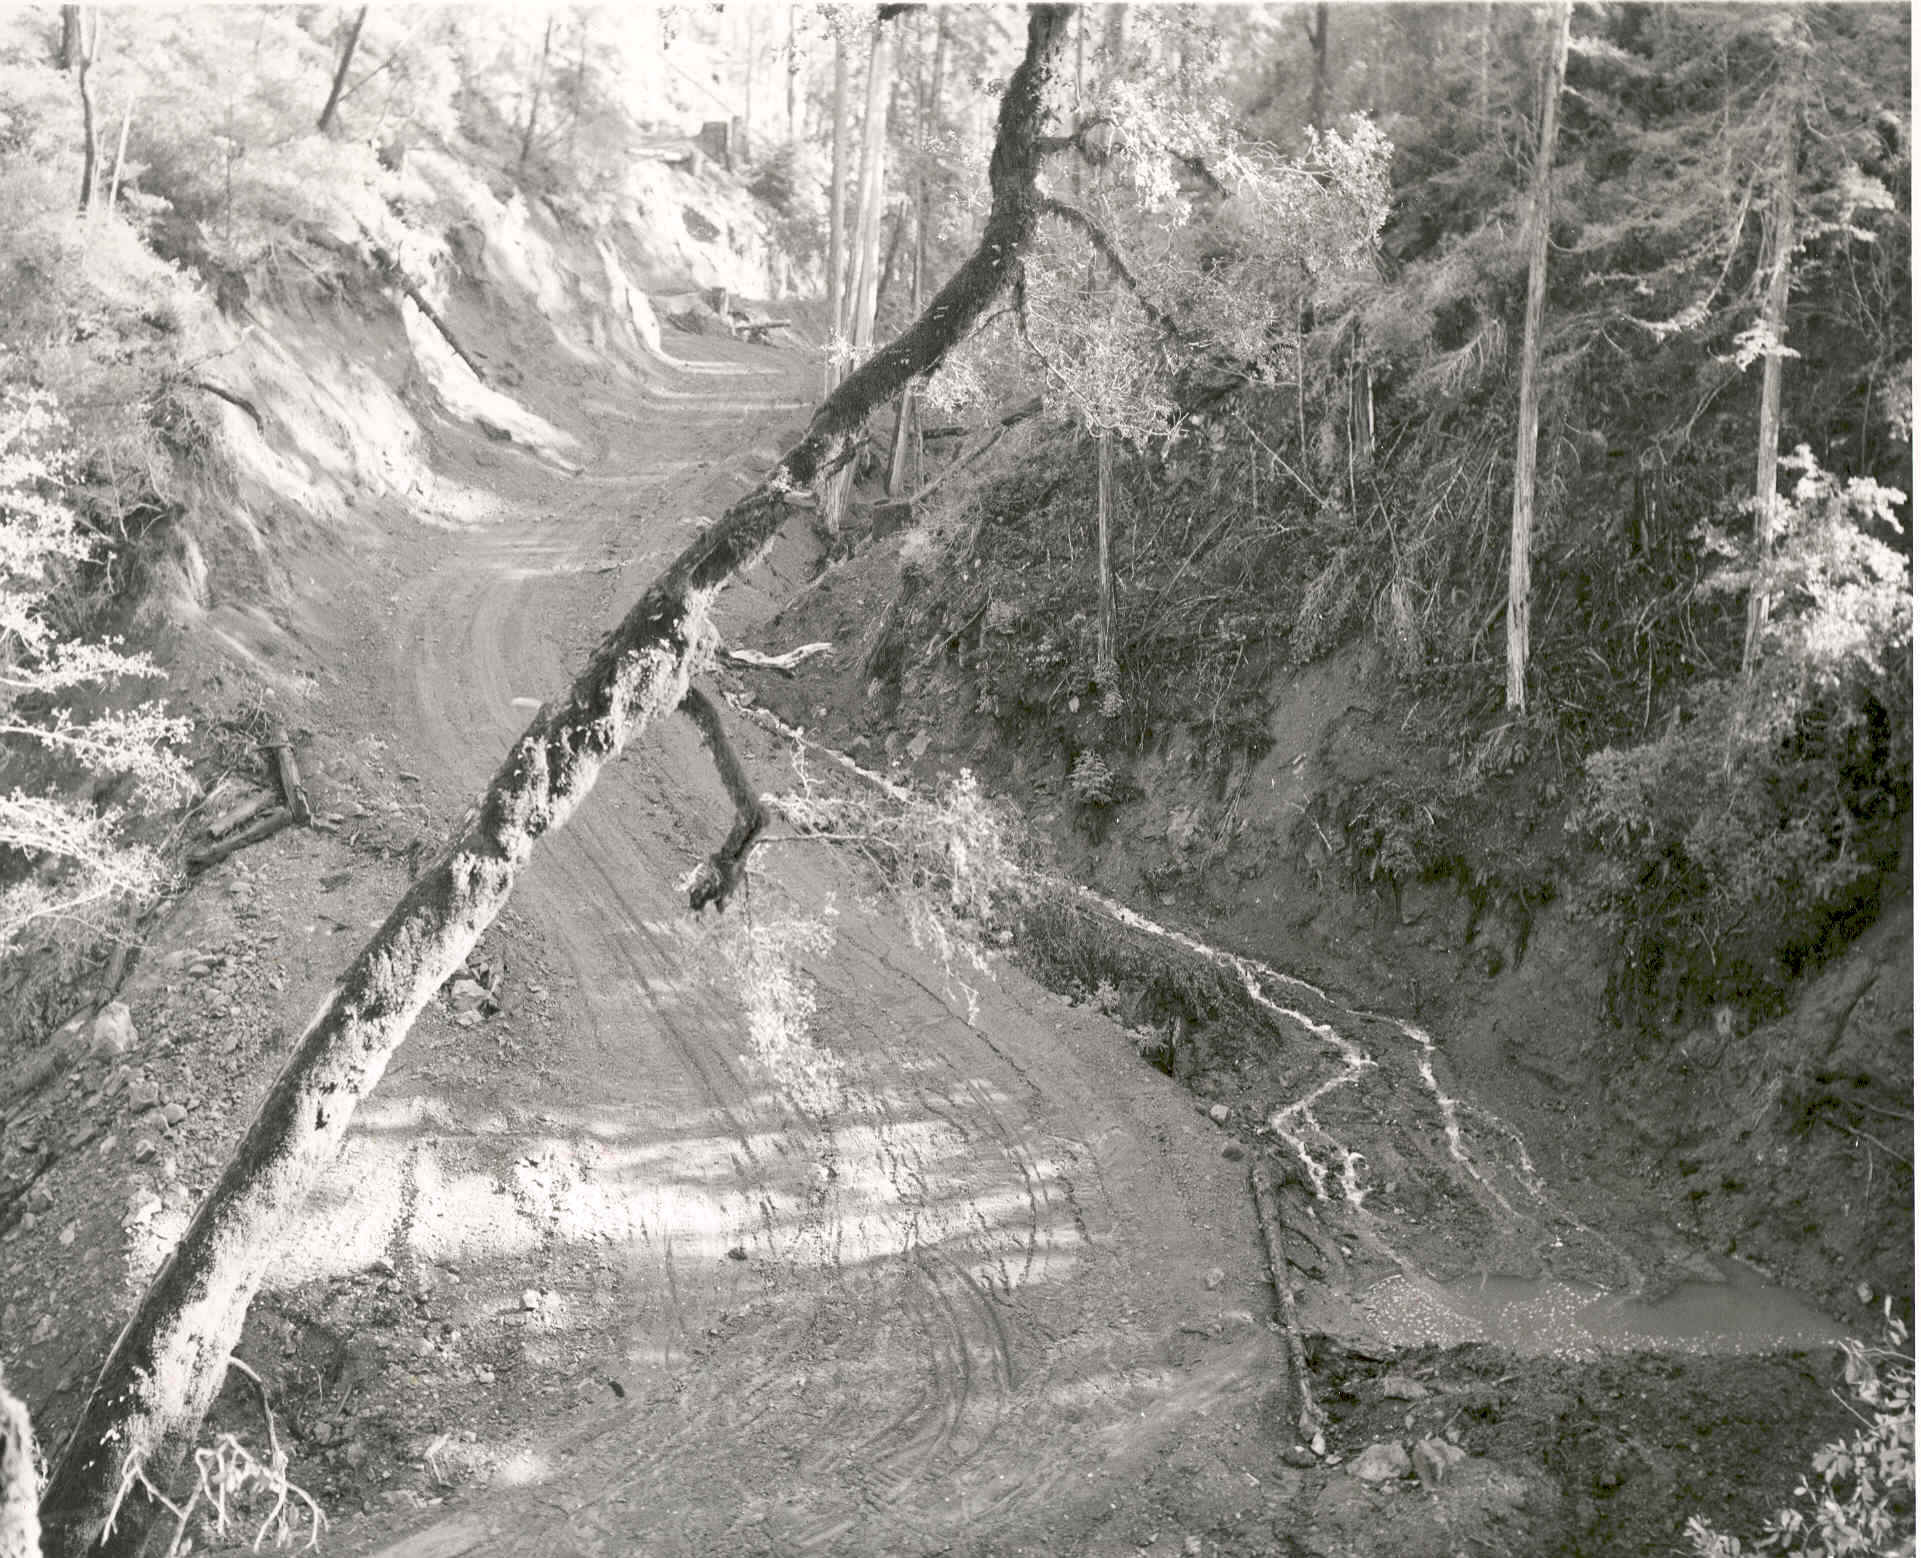 Figure 1. This photo shows a logging road built on top of an ephemeral stream course in the Signal Creek sub-basin. Note the rills and gullies forming on the road, which has a high risk of stream capture, where the stream might actually jump onto the road and wash away massive amounts of fill. Photo taken by the California Department of Fish and Game in 1955. Copied from the files of CDFG, Yountville, CA.
More recent land use activity has caused another sediment wave as well (U.S. EPA, 1998): "Pacific Watershed Associates (1997) also noted that during the past 10 years, approximately 43% of the Garcia River watershed has experienced a renewed period of timber harvesting and road reconstruction which may cause an increase in sediment production." Some evidence of such a sediment pulse, which then traveled through the lower Garcia River, can be seen in photographs from KRIS Garcia. Aerial photos show that sediment was contributed from areas disturbed by timber harvest and associated roads in Olsen Gulch (Figure 2), which was typical of disturbance and response of other Garcia River sub-basins. Photographic evidence also shows that sediment from Olsen Gulch was elevated in 1995 Figure 3), but greatly reduced between 1995 and 2002 (Figures 4). This indicates that sediment sources in Olsen Gulch declined after the sediment pulse related to recent logging. Timber harvest in the late 1990's has been much less intensive and so potential sediment yield from this land use activity has diminished.
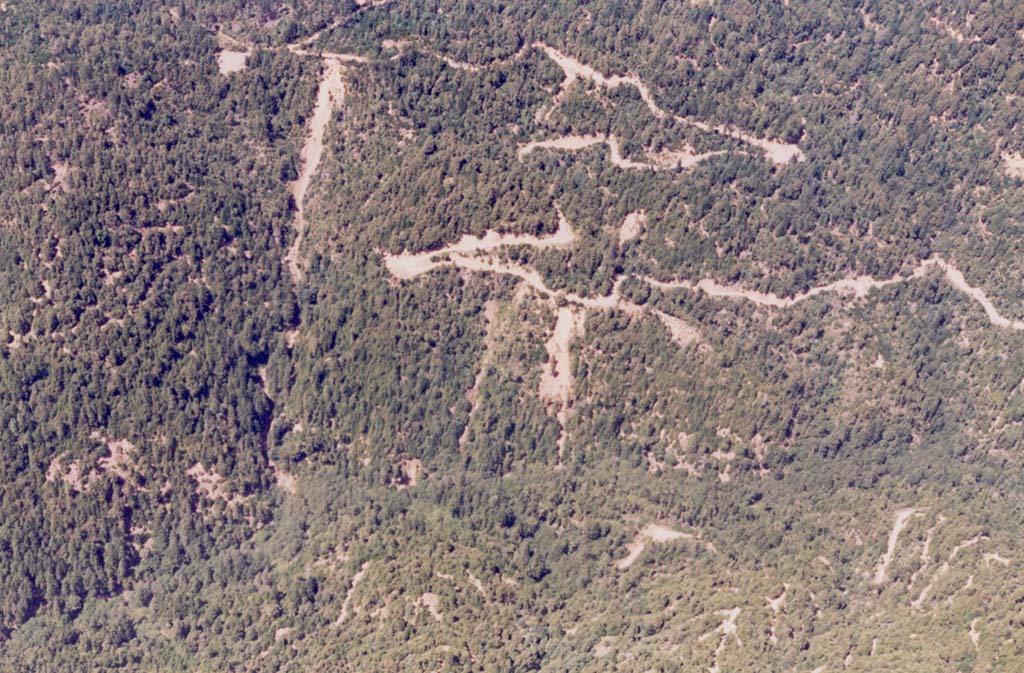 Figure 2. This photo shows a timber harvest in Olsen Gulch that was permitted in 1989 (THP 1-89-568 MEN). The photo, taken in September 1995, shows shallow debris flows which started at roads associated with the timber harvest and may have initiated during the major storms of January and March 1995. Pacific Watershed Associates (1997) noted that a great deal of "controllable" sediment in the Garcia River watershed comes from roads.
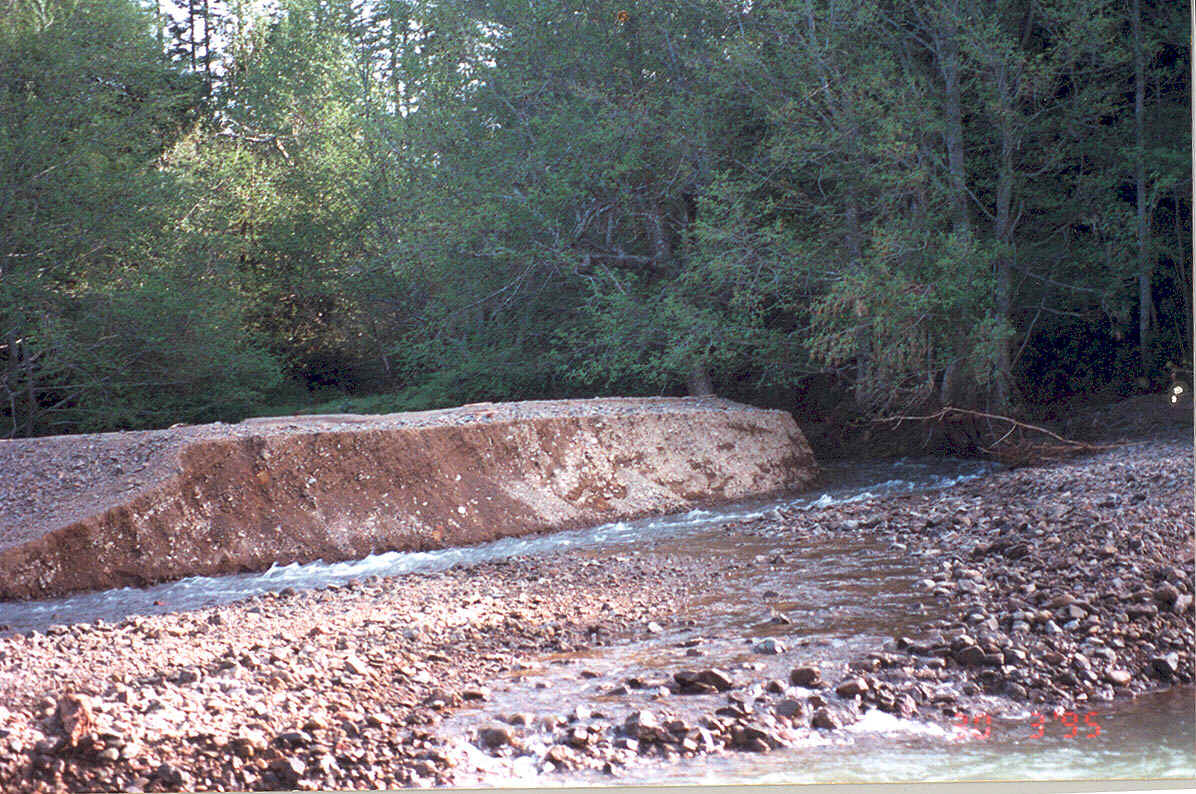 Figure 3. This picture shows Olsen Gulch as it meets the Garcia River and a terrace of sediment that formed after the January and March storms of 1995. The small particle size distribution of the delta material indicates recent contribution (Dietrich et al., 1989). Figure 2 shows at least one potential sediment source that could have contributed to this problem. Photo provided courtesy of Craig Bell. 3/30/95
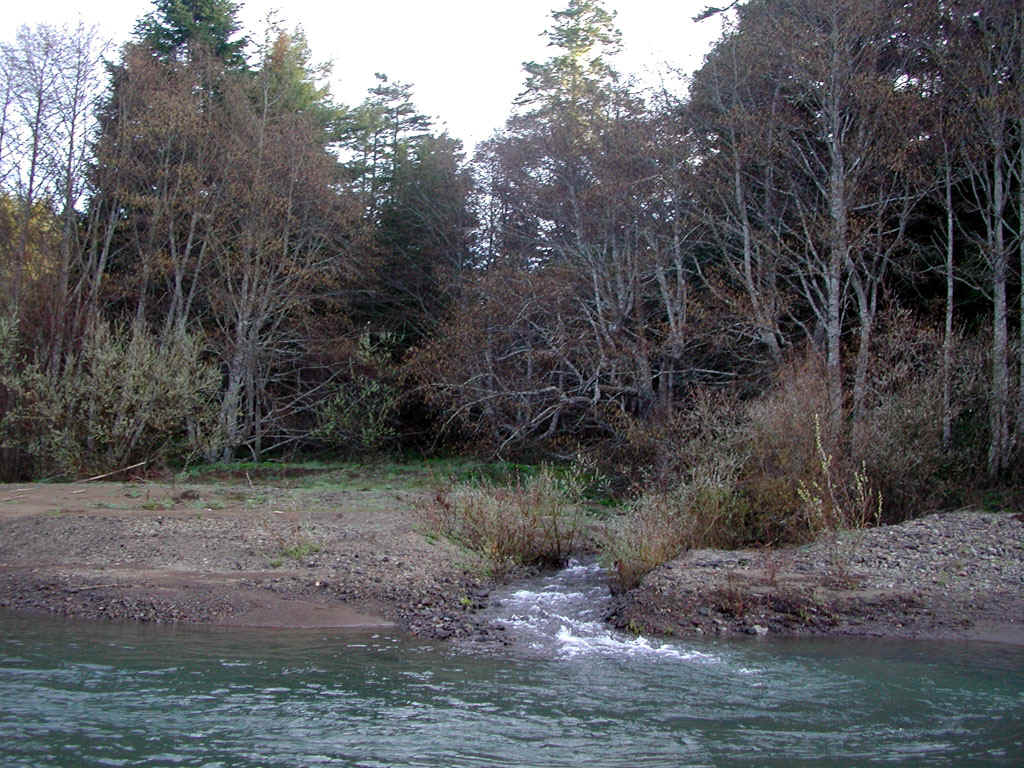 Figure 4. The mouth of Olsen Gulch in February 2002 has no terrace of fine sediment evident. Notice the coarser material now in the channel and on the terraces. This indicates a decreased sediment supply from Olsen Gulch compared to the 1994-1995 era, after a period of rest from logging. It appears that sediment sources from logging in the late 1980's are spent. Photo by Pat Higgins. 2/10/02.
Although the Mendocino County RCD (1992) cited accounts of local fishermen describing the disappearance of many holes on the lower Garcia River and the filling of the estuary, it also noted that the lower river had a stable bed form and was, therefore, not radically oversupplied with sediment. The Garcia TMDL (US EPA, 1998) states that " the filling once noted in the estuary and lower mainstem appears to be reversing-- an indication that the process of recovery has begun." Phillip Williams Assoc. (1996) gravel budget for the lower Garcia and did not find a large surplus of aggregate on the gravel bars or a high rate of supply. Their findings were characterized by the US EPA (1998) as follows: "The lack of major aggradation and thalweg incision in the lower Garcia River main stem during the last few years suggests either that stored sediment in tributary streams was insignificantly mobilized to the lower river reaches as a result of the big storms over these years and/or that sediment production through the watershed from upstream hillslope areas was not severe."
Bank erosion was a significant sediment source to the lower Garcia River in the early 1990's. Pasture land often had no riparian buffer strips and some bank areas were bare soil and highly subject to bank erosion (Figure 5). Extensive riparian restoration has helped heal many eroding banks on the lower river Garcia River and reduce this sediment source (Figure 6) as well as improve fish habitat (Bell, 2003).
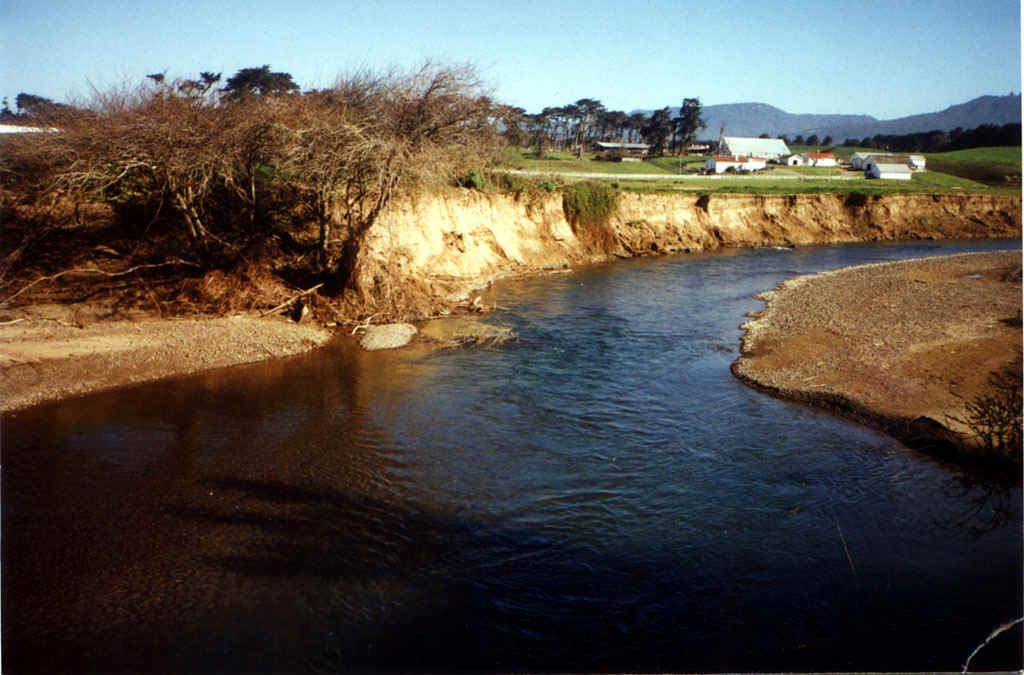 Figure 5. An eroding bank on the lower Garcia River just upstream of Highway 1 on the Henry Stornetta Ranch in August 1994. This site is representative of a number of private land locations in the lower seven miles of the Garcia River where eroding banks were sediment sources. Stream banks in this condition pose the highest risk of loss of agricultural land during storm events.
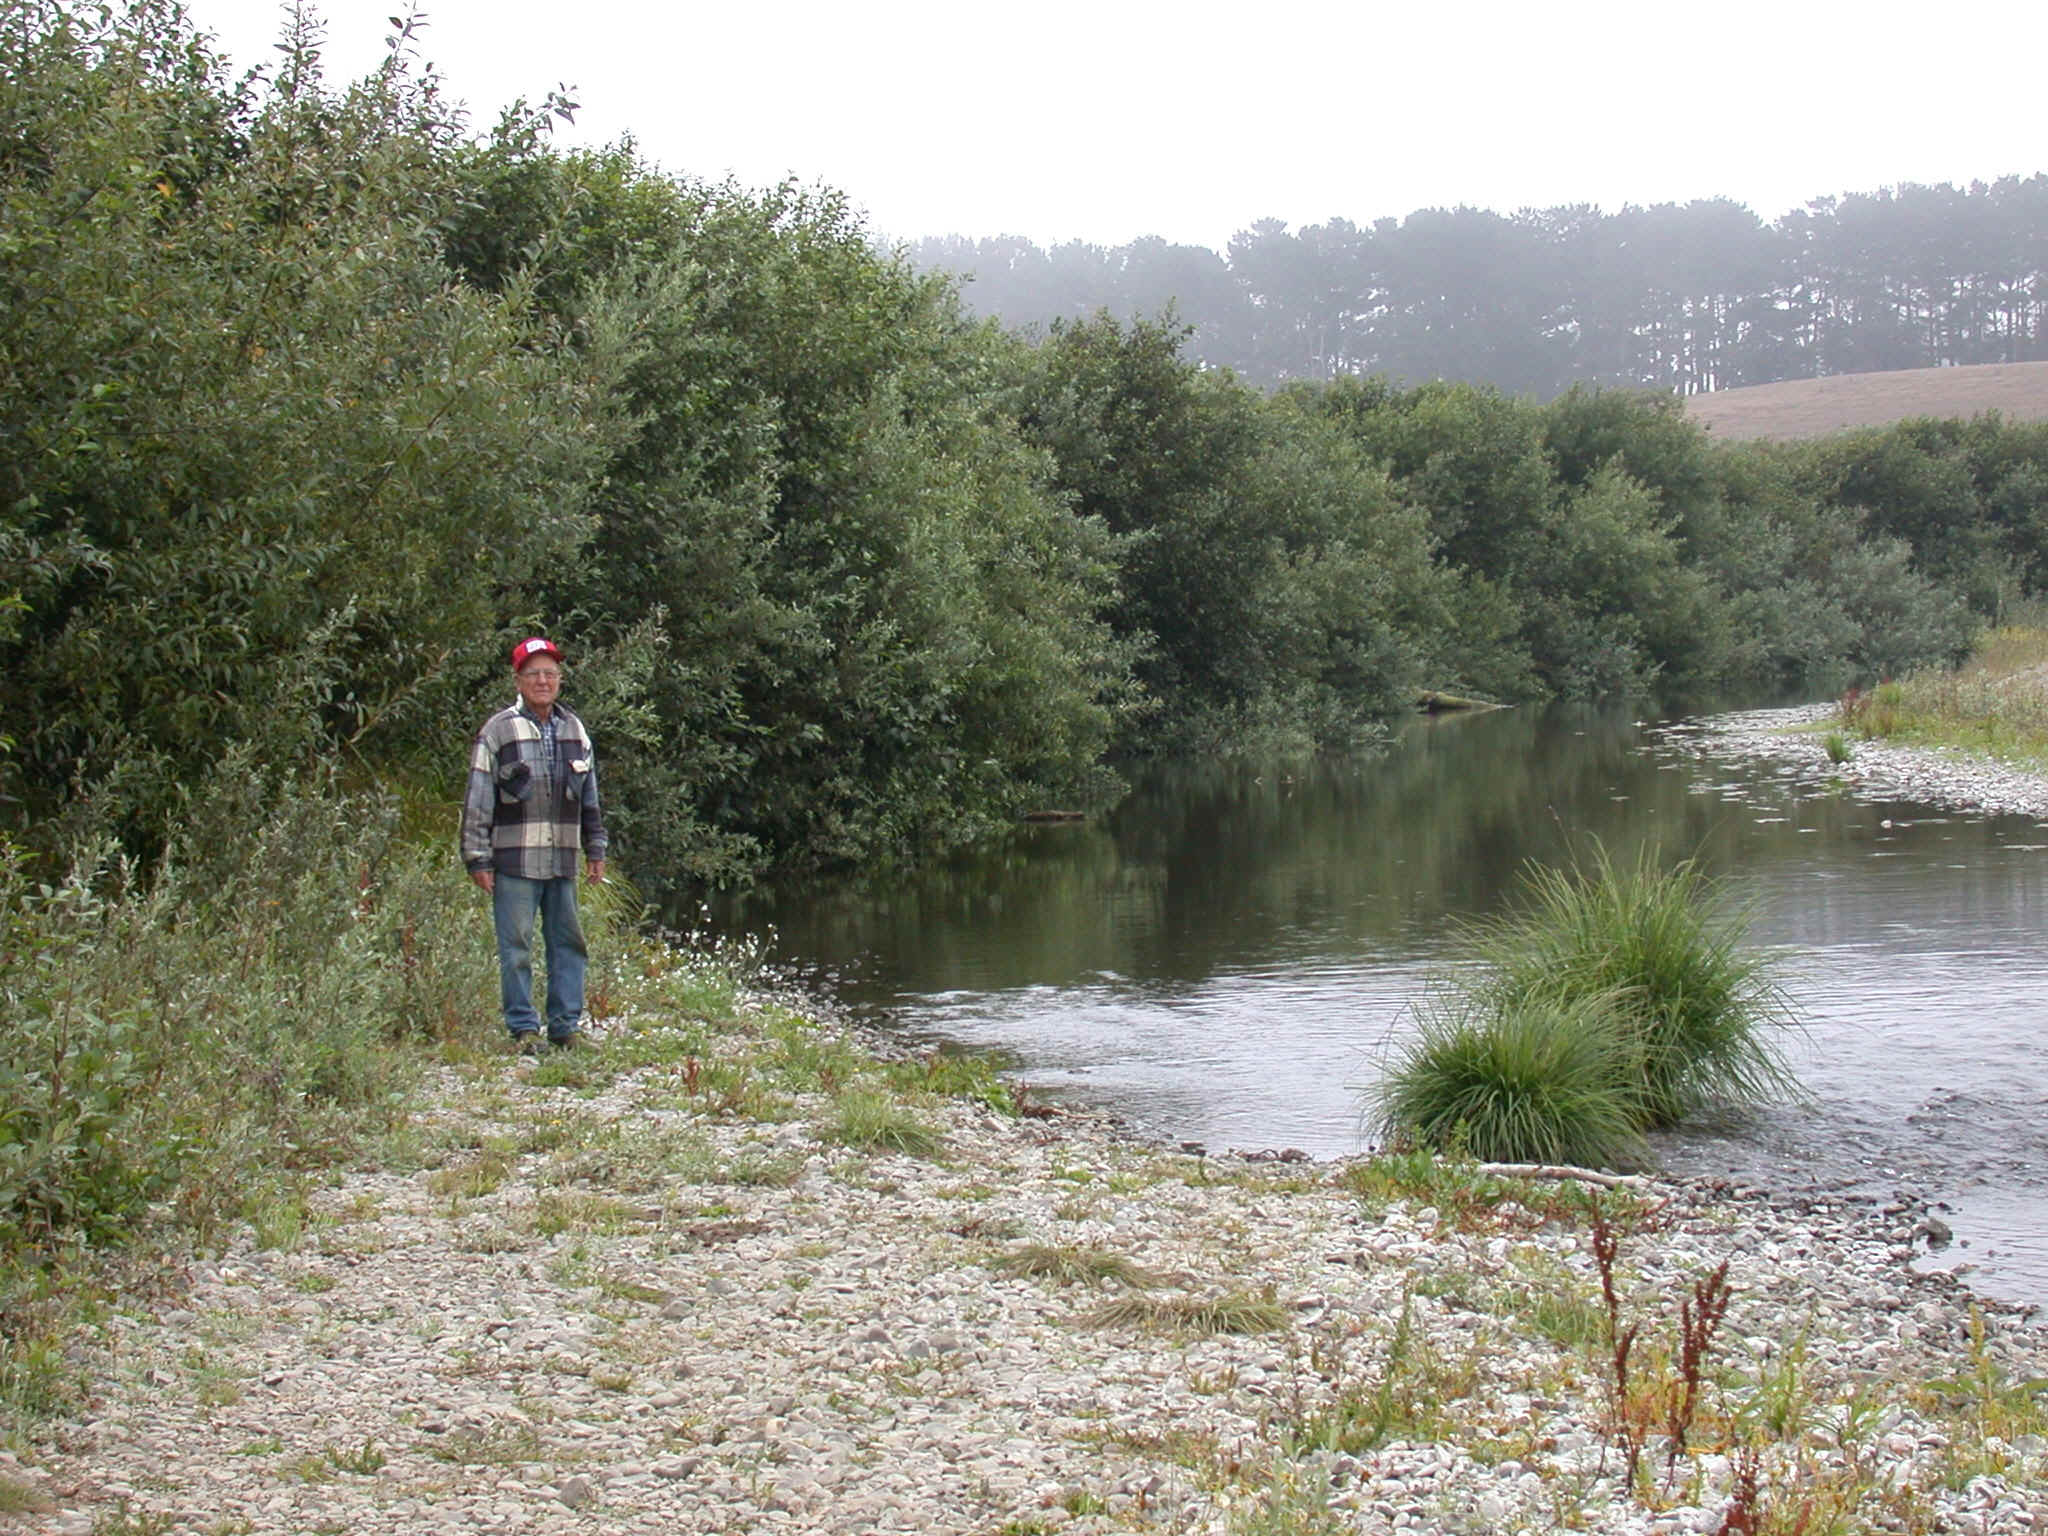 Figure 6. The same riparian area just upstream of Highway 1 after several years of restoration. Not only is there good bank protection, but the willows and alders provide excellent cover for juvenile salmonid rearing. Support for the project came from local volunteers, elementary and high school students, Trout Unlimited and the Americorp Program as well as the local land owner. Henry Stornetta stands next to the restored riparian area and stable bank on his dairy farm just upstream of Highway 1 in August 2002.
Leopold and McBain (1995 in Moffett Nichol Engineers, 1995) measured cross sections and used existing data to conclude that the lower mainstem and estuary of the Garcia River were getting deeper as a result of the January and March 1995 storm events, which were both high intensity, low recurrence interval storms. They also noted that point bars were getting higher, which helped focus the river’s energy, digging deeper corner pools in the lower river. They concluded that the Garcia was no longer oversupplied with gravel and that gravel extraction would inhibit the point bar build up and impede channel recovery.
Jackson's (1998, 1999) results also indicate that the estuary and lower Garcia River thalwegs (the deepest part of the channel) were increasing in depth and that point bars were building (Figures 7-8). When sediment supply is decreased, the river channel scours deeper or pools widen, so the volume of fish habitat increases. The Baxman cross sections (Figure 8) are locations where the depth of the thalweg increased and scoured a pool of approximately four feet in depth as of 1998, where the pool was less than half that in 1991.
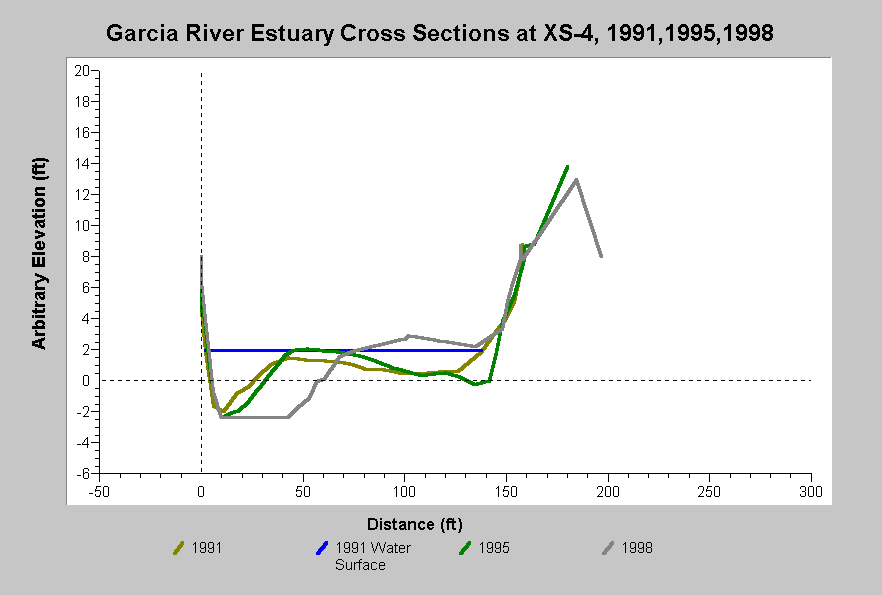 Figure 7. This chart shows results of the Garcia River Estuary cross-section XS-4 surveys conducted in 1991, 1995, and 1998. While the depth of the stream remained fairly constant, the pool in the cross section widened between 1991 and 1998, substantially increasing its volume. This is consistent with a low sediment supply. Data are from Jackson (1998).
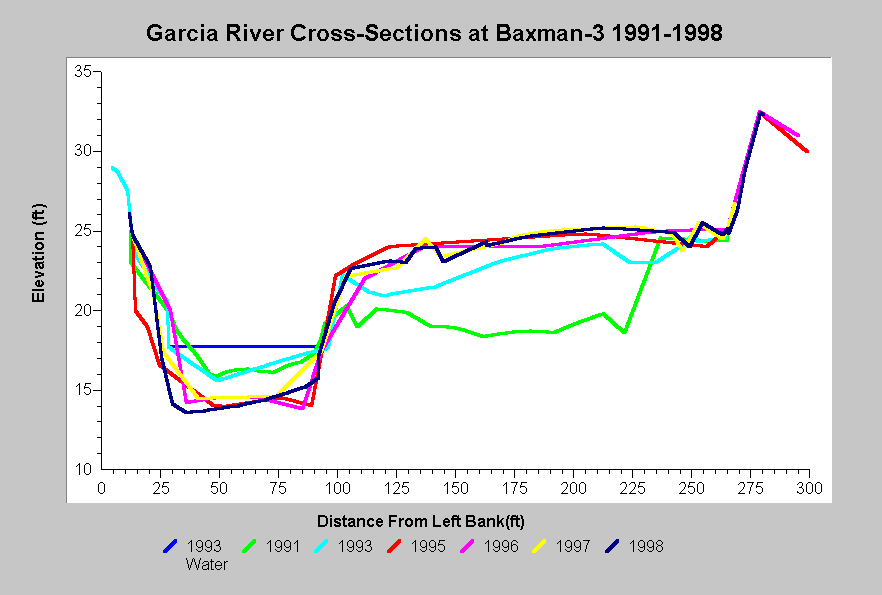 Figure 8. This chart shows Garcia River cross-section surveys established by the Baxman Sand and Gravel in 1991, and then continued by the Mendocino County Water Agency after 1993. The cross-sections show slight aggradation occurred between 1993 and 1996, then scour in 1997 which continued through 1998. The pool habitat that shows at left in the profile was about four feet deep in 1998. Data from Jackson (1998).
Photographic records of the mainstem Garcia River show a decrease in particle size distribution, an improving width-to-depth ratio, and pool formation just below Highway 1 between 1994 and 2003 (Figure 9-10).
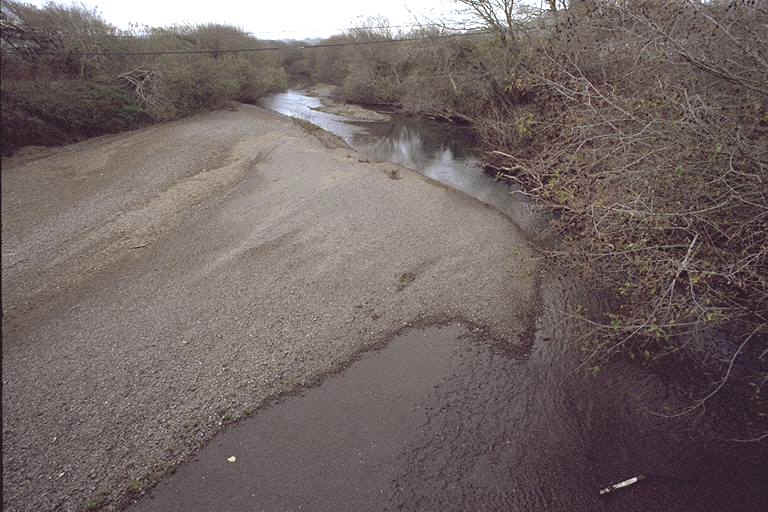 Figure 9. This photo, taken looking downstream of Highway 1 in 1994, shows a highly aggraded mainstem Garcia River channel with very small particle size distribution, including patches of surface silt or sand. Note the island of sediment mid-channel at a distance and compare with the photo below at the same location in May 2003. Photo by Peter Dobbins.
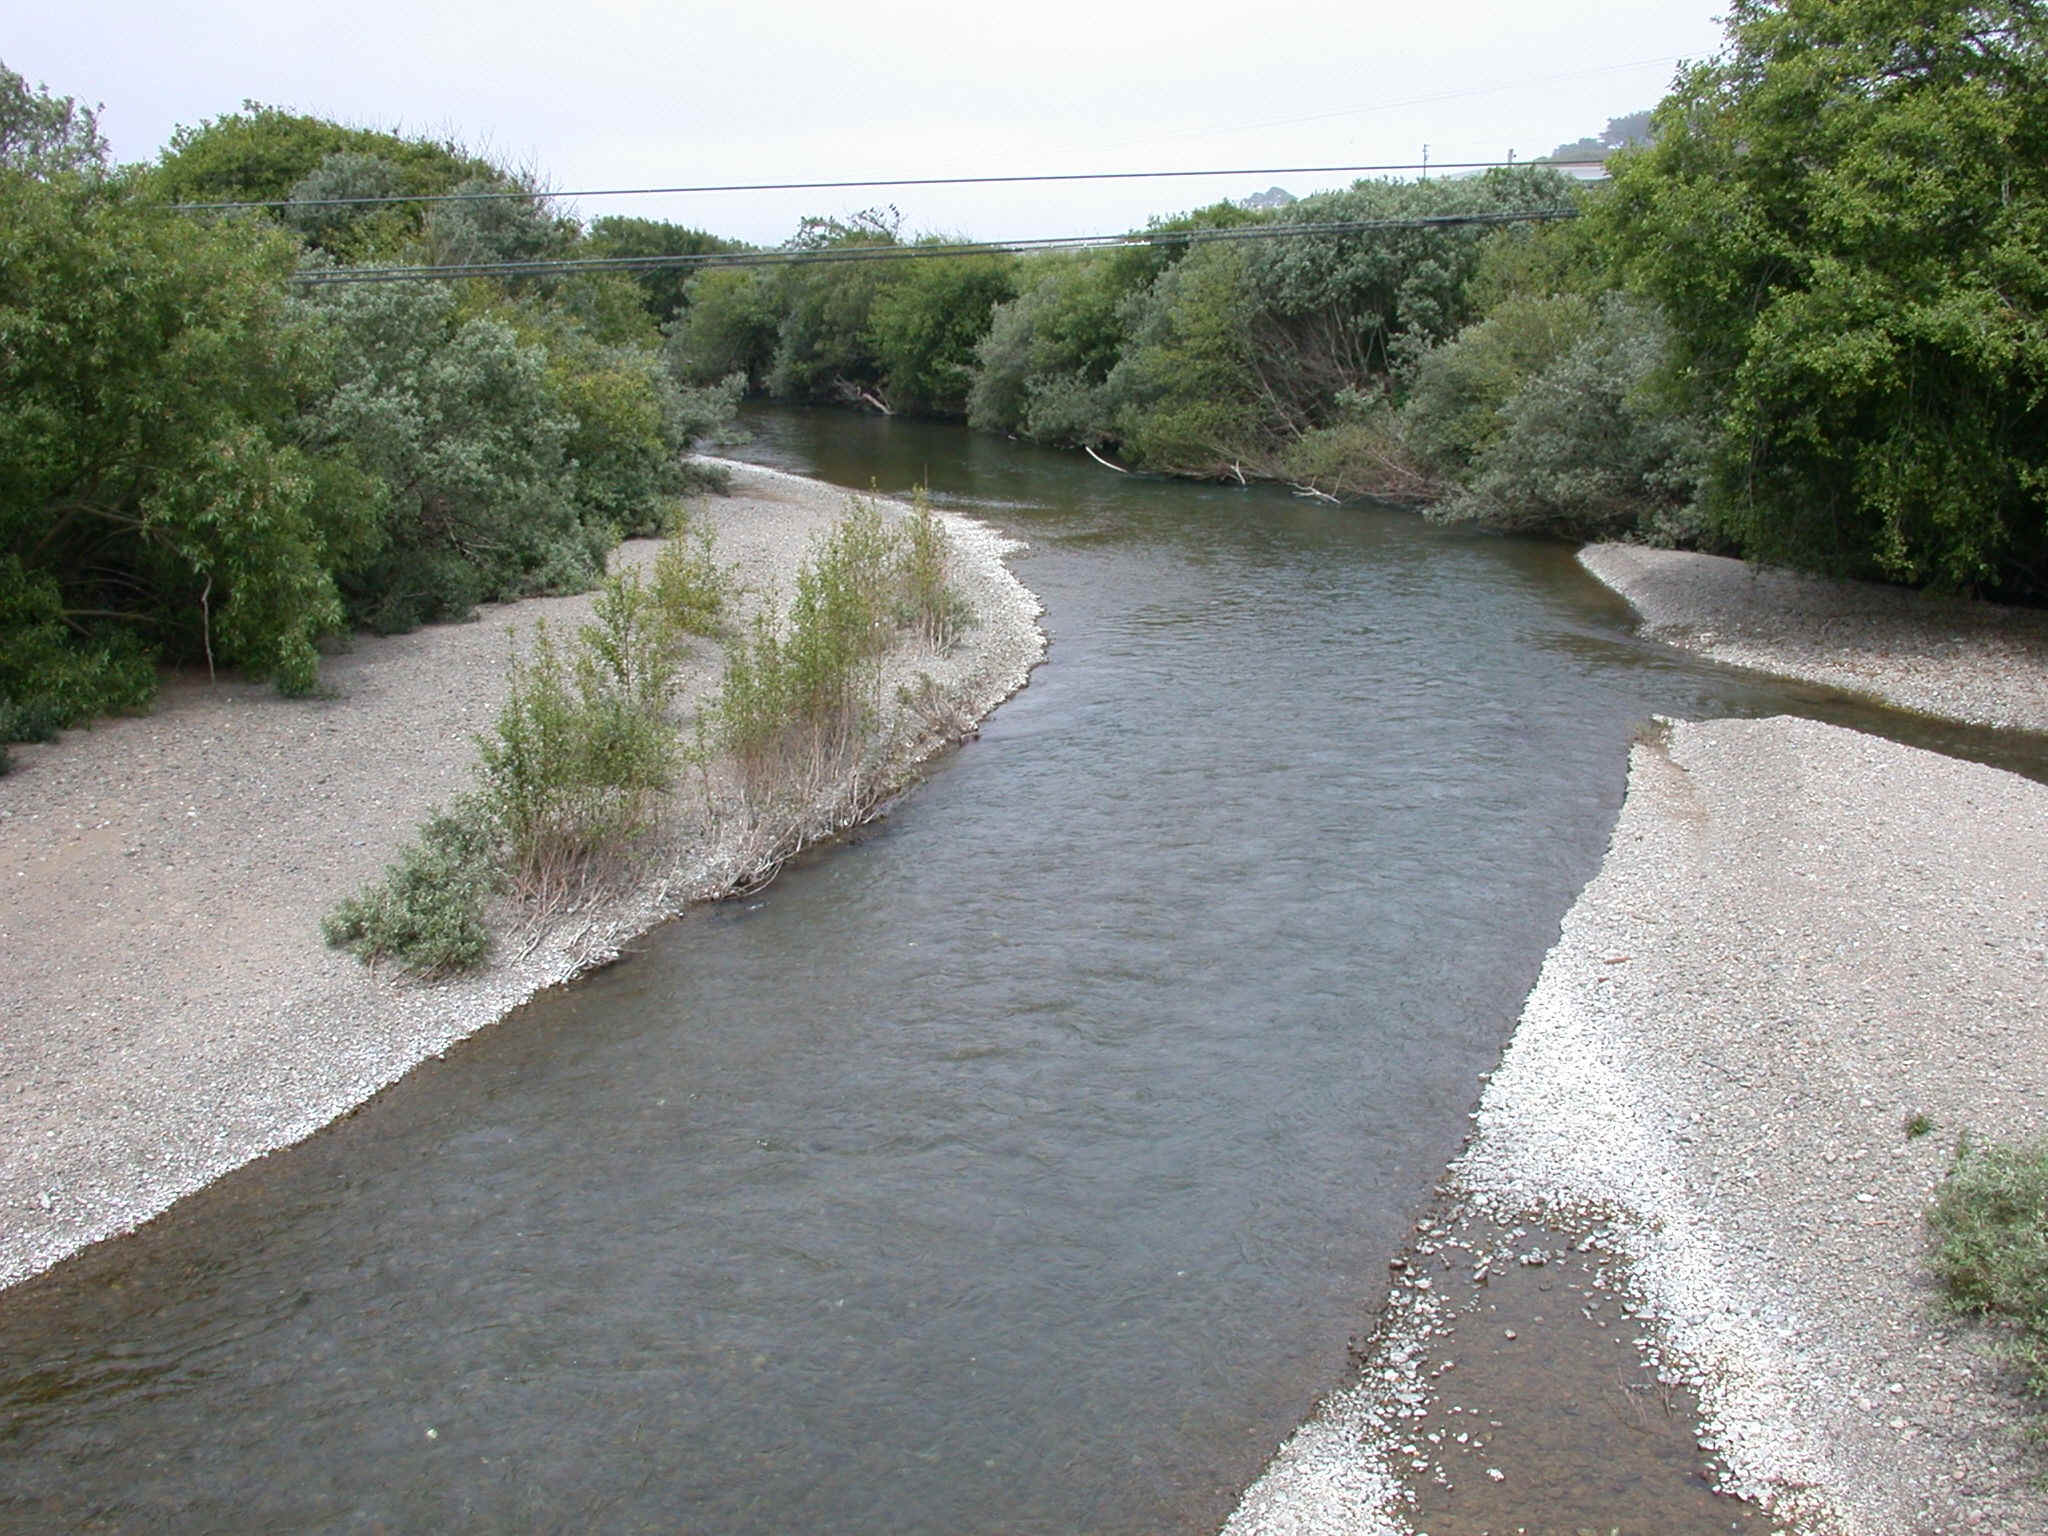 Figure 10. Garcia River in May 2003, looking downstream from the Highway 1 Bridge. The place where the sediment plug resided mid-channel in 1994 is now a pool. The bar also consists of more gravel sized particles and less fines, indicating a reduction in the amount of sediment of recent origin. Colonization of the gravel bar by willows is also indicative of reduced bed load transport. Photo by Craig Bell.
The following is a list of Topics in KRIS Garcia where you can see data in its context, Metadata and associated Info Links. The large-case letters in parentheses indicate KRIS sub-basins.
(BW) Tour: 4. Garcia River Historical Photos, 1955 and 1962 Logging
(MG) Tour: Olsen Gulch Watershed Conditions/Logging 1995
(BW) Tour: Sediment Transport Photos 1994-2003
(LG) Tour: Restoration #1 Henry Stornetta Site #1N Before/During/After
(LG) Stream Channel: Cross-Sections - Garcia Estuary XS-3, 1991-1998
(LG) Stream Channel: Cross-Sections - Garcia at Baxman-3, 1991-1998
(BW) Tour: Sediment Transport and Supply Photos 1994-2003
Alternate Hypothesis
The lower mainstem Garcia River is aggrading.
Some cross sections from the lower Garcia River do not show down cutting (LG Topic: Stream Channel: Cross-Sections - Garcia at Baxman-4, 1991-1998) and the same is true at some Middle Garcia sites (MG Topic: Stream Channel: Cross-Sections - Garcia at Old Pier, 1993-2002); therefore, it may be that there is no net degradation in the lower Garcia. The estuary also shows aggradation at some cross sections (LG Topic: Stream Channel: Cross-Sections - Garcia Estuary Mouth XS-2, 1991-1998) and it has yet to show signs of narrowing and deepening to conditions similar to 1942 (LG Topic: Tour: Aerials Garcia Estuary 1942-1998).
Monitoring Trends to Test the Hypothesis
Data that need to be collected to test this hypothesis are cross sections and pool depths in the lower Garcia River. Cross sections should be repeated at locations similar to Jackson (1998, 1999) and Leopold and McBain (1995 in Moffett Nichol Engineers, 1996) to discern trends in aggradation or degradation. The lower Garcia River could easily be surveyed for maximum pool depth from the North Fork to the estuary and results compared to data collected during 1991 habitat typing surveys that were conducted for the Mendocino County Resource Conservation District (1992).
References
Bell, Craig. 2003. Evaluation of Garcia River restoration with recommendations for future projects. Prepared for California Department of Fish and Game by Trout Unlimited. [121 kb]
California Department of Fish and Game (CDFG) . 1966. Stream damage surveys -- 1966. Written by L. Fisk, E. Gerstung, R. Hansen, and J. Thomas. Inland Fisheries Branch, CDFG. 15 pp. [162kb]**
Dietrich,W. E., J.W. Kirchner, H. Ikeda, and F.Iseya. 1989. Sediment supply and the development of the coarse surface layer in gravel-bedded rivers. Nature. Vol. 340: 215-217.
Hagans, D.K, and P.T. Higgins. 1996. Analysis of Stream Channel Recovery of the North Fork Garcia River Using a Modified RAPID Methodology. Performed under contract to Coastal Forest Lands, Willits, CA. 5 p.
Jackson, D. 1998. Analysis of the 1997 Garcia River cross sections. Friends of Garcia River. Ukiah, CA. 53 pp. [450kb]
Jackson, D. 1999. Analysis of the 1998 Garcia River cross sections. Mendocino County Resources Conservation District. Ukiah, CA. 58 pp. [900kb]
Kramer, S. H., M. Trso, and N. P. Hume. 2001. Timber harvest and sediment loads in nine Northern California watersheds based on recent total maximum daily load (TMDL) studies. Watershed Management Council Networker 10(1):1, 17-24. 40 pp. [2.0Mb]
Mangelsdorf, A. editor.1997. Assessment of aquatic conditions in the Garcia River watershed. Prepared in support of the Garcia River watershed water quality attainment strategy for sediment. California Regional Water Quality Control Board, North Coast Region. Santa Rosa, CA. 283 pp.
Moffett Nichol Engineers. 1996. Garcia Estuary Enhancement Feasibility Study. Performed under contract to the Mendocino RCD. Moffet Nichol Engineers, San Francisco, CA.
Mendocino County Resource Conservation District (MCRCD). 1992. Garcia River Watershed Enhancement Plan. Prepared for the California State Coastal Conservancy. Prepared by MCRCD, written by Jack Monschke and D. Caldon, Kier Associates. Ukiah, CA. 207 pp. [3.1Mb]**
Pacific Watershed Associates (PWA). 1997. Sediment production and delivery in the Garcia River watershed, Mendocino County, California: An analysis of existing published and unpublished data. Prepared for Tetra-Tech, Inc and U.S. Environmental Protection Agency. Arcata, CA. 42 pp. [605kb]**
Philip Williams & Associates Ltd (PWA). 1996. Garcia River Gravel Management Plan. Prepared for Mendocino County Water Agency by PWA, with Circuit Rider Productions, Inc., Steiner Environmental Consultants, Leonard Charles Associates. San Francisco, CA . 160 pp. [5.8Mb]**
U.S. Environmental Protection Agency (USEPA). 1998. (Final) Garcia River sediment total maximum daily load. Dated 16 March 1998 . USEPA, Region IX . San Francisco, CA . 51 pp. [130kb]