Bibliography Background About KRIS
Hypothesis #5: Alteration of riparian stands has increased stream warming, even where direct shade has been retained.
Supporting Evidence from the Literature
Some Noyo River basin tributaries have elevated water temperatures and also a sparse riparian buffer zone. Substantial current scientific literature suggests that alteration of the riparian canopy, even well back from the stream, can open air flow and change the microclimate over the stream (Brosofske et al., 1999). Increasing airflow, particularly in areas with high summer air temperatures, can increase heat exchange with the stream and thereby elevate water temperatures (Bartholow, 1989; Poole and Berman, 1999). For a full discussion of factors influencing stream warming, please see the Temperature web page. The U.S. Forest Service has developed a California-wide vegetation map derived from 1994 Landsat imagery, which includes the Mendocino coast and the Noyo River basin (Warbington et al., 1998; Schwind, 1999). The imagery provides a way to view forest stand conditions, at the one hectare scale. These data were used in the KRIS Map project to characterize tree size over the landscape and as a riparian analysis tool when applied to a 90 meter riparian buffer strip on each side of the channel. Please see Riparian Information in KRIS and Vegetation Types for more background information on how remote sensing imagery is used in KRIS.
From the Noyo
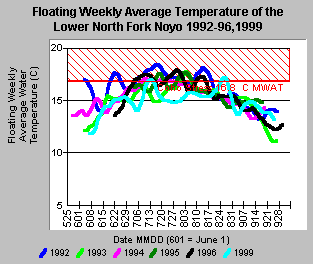
Valentine (1994, 1996, unpublished) studied water temperatures in tributaries to the South Fork Noyo River and other areas of Jackson demonstration State Forest and noted potential problems only in lower Parlin Creek. He noted that air temperatures warmed in proportion to distance from the coast. Water temperature data from the Noyo River basin shows that the North Fork Noyo River at Hayworth Creek is elevated in temperature when the upper North Fork and the Middle Fork North Fork, just upstream, are not. North Fork water temperatures at Hayworth Creek show that the floating weekly average temperature exceeds 16.80 C which was found by Welsh et al. (in press) and Hines and Ambrose (1998) to be the limit of habitability for coho salmon. California Department of Fish and Game (CDFG, 1967) indicated that this reach harbored coho salmon in 1966 and more recent samples by Mendocino Redwood Company show coho to be absent in some years and present at very low levels in others (see Hypothesis #1). USFS vegetation coverages from the KRIS Map project can be used to view a 90 meter riparian zone of influence of the North Fork Noyo River above Hayworth Creek. The riparian stands are characterized as largely early seral conditions. An orthophotoquad of the northwest quadrant of the Northspur orthophotoquad from the U.S. Geologic Survey shows that larger trees have been retained to shade the stream but that the width of the buffer ranges from approximately 35 meters to 160 meters in total width in this reach. The evidence presented here suggests that the North Fork Noyo River has warmed between the Middle Fork North Fork and Hayworth Creek because of an insufficient riparian buffer.
Source Topics: The charts below are derived from the Topics listed here. Check these Topics in the KRIS database to see information in context and to have access to InfoLinks and Metadata.
(NF) Temperature: Floating Weekly Average NF Noyo Above Hayworth
(NF) Temperature: Floating Weekly Average Middle Fork North Fork
(NF) Temperature: Floating Weekly Average Upper North Fork Noyo
 |
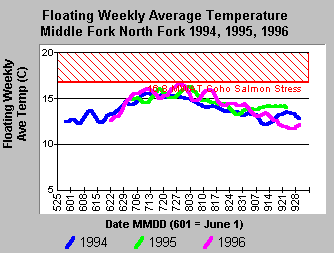 |
| The floating weekly average water temperature of the North Fork Noyo River above Hayworth Creek exceeds 16.80 C in all years measured, which makes it too warm for coho. This reach formerly supported coho salmon juveniles (CDFG, 1967). Data provided by MRC. | The Middle Fork North Fork Noyo River did not exceed the 16.80 C threshold for coho stress during the summers of 1994-1996. This stream is one of the tributaries to the North Fork Noyo River reach represented at left. Data provided by MRC. |
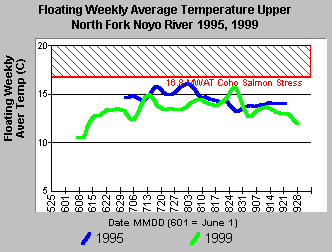 The upper North Fork Noyo River, above the Middle Fork Noyo, did not reach the 16.80 C threshold for coho stress during the summers of 1995 or 1999. Stream temperatures were even cooler than the MF North Fork. In combination, these streams would yield suitable water temperature for coho in the North Fork below the MF North Fork. Therefore, the North Fork Noyo River warms considerably from the Middle Fork North Fork to Hayworth Creek and changes to stressful or uninhabitable for coho salmon. Data provided by MRC.
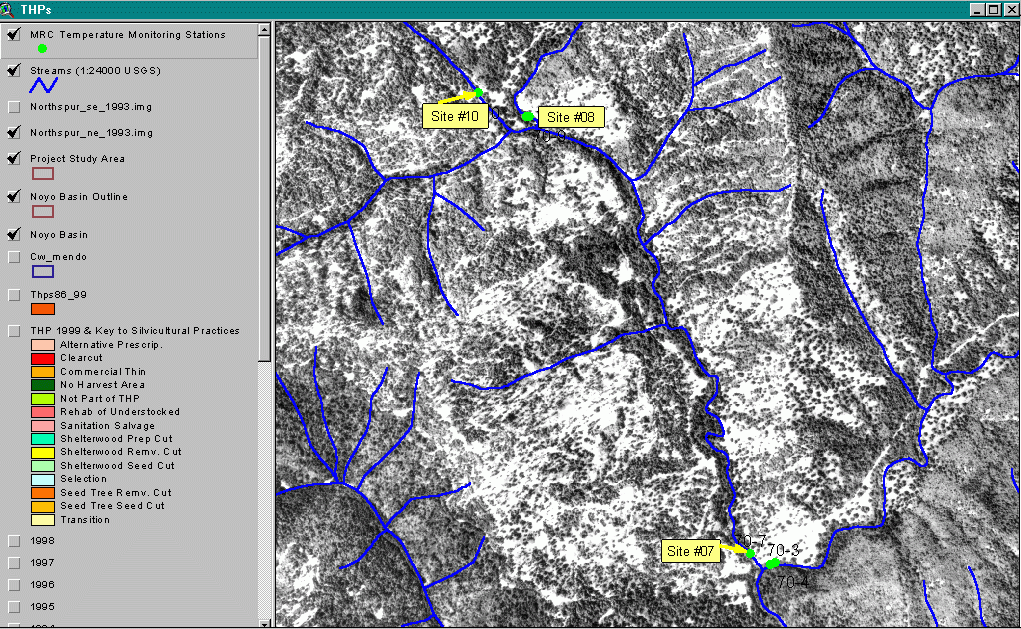
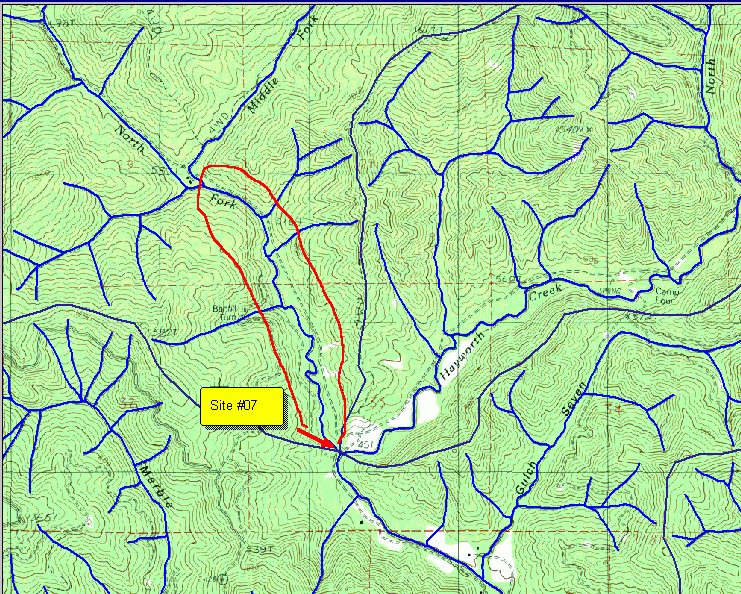 The USGS topo map at left shows the MRC temperature data station #07 in the North Fork Noyo River just upstream of Hayworth Creek. The red circle denotes the reach below the Middle Fork North Fork which becomes elevated in temperature. Image taken from the KRIS Noyo Map project.
157 KB
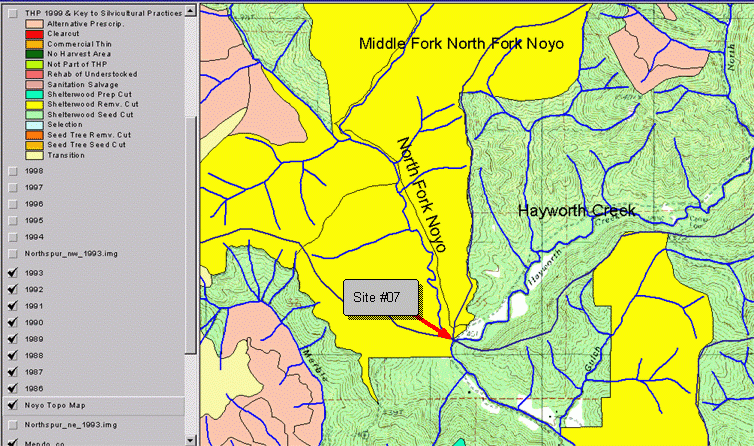 The image at right shows all timber harvests between 1986 and 1993 in the reach of the North Fork Noyo River just upstream of Hayworth Creek. The timber harvests were Shelterwood Removal Cuts and permits were filed for both 1986 and 1989 to the east of the stream. Image shows CDF timber harvest data as displayed in the KRIS Noyo Map project. 191 KB
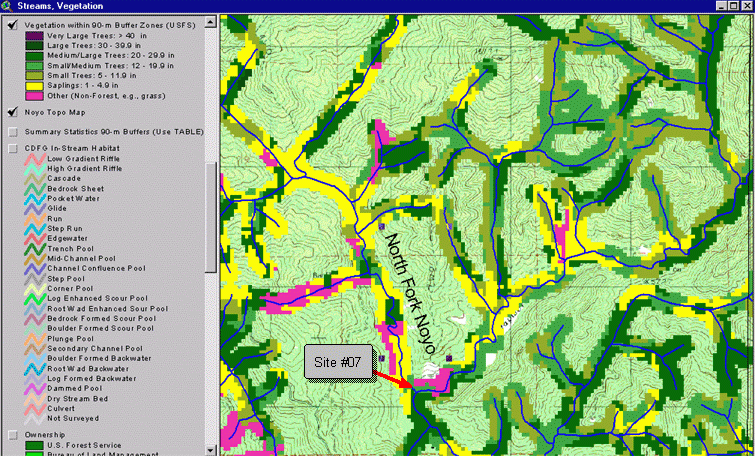 The U.S. Forest Service vegetation and timber stand analysis based on 1994 Landsat imagery was clipped in the image at left to 90 meters on each side of the North Fork Noyo River and its tributaries. The USFS data was quarried for tree size classification, not tree species or community. It characterizes riparian stands in the reach of the North Fork Noyo above Hayworth Creek as largely early seral stage with saplings (yellow = trees 1"-4.9") predominating and small trees (olive green = 5"-11.9") and non-forest (pink = shrubs, grass, bare soil) prevalent. Small medium tree stands (light green = 12"-19.9") and medium/large trees (green = 20"-29.9") are present also. The USFS classification averages stand conditions and cannot be interpreted on a pixel by pixel basis. Riparian zone leave-strip widths in this reach are often less than 100 meters or three Landsat pixels which is not sufficient to show as large trees when averaged with upland vegetation at the one hectare scale. Consequently, the USFS riparian data should be used only as a reconnaissance tool and actual stand conditions should be checked using aerial photographs or field visits.
 This USGS orthophotoquad shows the stream reach of the North Fork Noyo River upstream of Hayworth Creek and its riparian zone. The buffer of with large trees varies in width from approximately 35 to 160 meters across from Hayworth Creek upstream to the Middle Fork North Fork Noyo. Middle Fork North Fork and upper North Fork temperature stations, where cool readings were taken are at sites labeled #08 and #10, respectively. While the canopy may provide direct shade to the North Fork, thinning the overstory has allowed changes in air flow and microclimate over the stream (Poole and Bergen, 1999). The lack of a multi-tiered canopy of conifers extending back from the stream is likely linked to the elevation of water temperatures at this site. The USGS stream network in GIS is slightly in error with regard to the location of the actual channel as indicated by the orthophotoquad. Because the USFS vegetation coverage is only accurate at the hectare scale, the location error does not cause significant problems for use as a reconnaissance tool.
Alternative Hypotheses
Retention of direct shade, including hardwoods, prevents warming and increase in temperature is a result of other processes.
See McCauley, J. and A. Goos (2000), Annotated Bibliography of Information and Studies Relevant to Temperature, Salmonids, and Water Quality assembled by the Oregon Forest Industry Council and the Washington Forest Protection Association for support of this alternative hypothesis above.
Other factors such as increased stream width and decreased depth are a more significant mechanism for stream warming.
This hypothesis could be tested as described in the second paragraph the monitoring section below.
Monitoring Trends to Support or Refute the Hypothesis
Place temperature probes across riparian zones with different buffer retention and in the stream above and below reaches with closed and open canopy, but identical shade components. Study relationship of riparian over-story condition, air temperature (microclimate) and water temperature collecting Noyo specific data.
Monitor water temperature, and width to depth ratios in reaches upstream at various stations to determine the effect of this parameter in Noyo River tributaries, choosing reaches with similar canopy and riparian stand conditions to control for shade and microclimatic effects.
References
Bartholow, J.M. 1989 . Stream temperature investigations: field and analytic methods. Instream flow information paper no. 13. Biological Report 89(17). U.S. Fish and Wildlife Service, Fort Collins, Co.
Brosofske, K.D., J. Chen, R. J. Naiman and J. Franklin. 1997. Harvesting Effects on Microclimatic Gradients from Small Streams to Uplands in Western Washington. Ecological Applications. 7(4): 1188-1200.
McCauley, J. and A. Goos. 2000. Annotated Bibliography of Information and Studies Relevant to Temperature, Salmonids, and Water Quality. Oregon Forest Industries Council and Washington Forest Protection Association. 7 p.
Poole, G.C., and C.H. Berman. 2000. Pathways of Human Influence on Water Temperature Dynamics in Stream Channels. U.S. Environmental Protection Agency, Region 10. Seattle, WA. 20 p.
Schwind, B. 1999. USFS Thematic Mapper Landsat Vegetation Coverage Background Information. USDA Forest Service. Pacific Southwest Region Remote Sensing Lab. Sacramento, CA.
Warbington, R., B. Schwind, C. Curlis and S. Daniel. 1998. Creating a Consistent and Standardized Vegetation Database for Northwest Forest Plan Monitoring in California. USDA Forest Service. Pacific Southwest Region Remote Sensing Lab. Sacramento, CA.