Bibliography Background About KRIS
Water Quality: pH, Alkalinity, and Conductivity
The excerpts below are from Deas, M.L. and G.T. Orlob. 1999. Klamath River Modeling Project. Project #96-HP-01. Assessment of Alternatives for Flow and Water Quality Control in the Klamath River below Iron Gate Dam. University of California Davis Center for Environmental and Water Resources Engineering. Report No. 99-04. Report 236 pp. Images and captions are not from Deas and Orlab (1999).
pH, alkalinity, and conductivity are several parameters useful in the evaluation of surface waters. The molar concentration of hydrogen ion is expressed through pH. At a given temperature, pH indicates the intensity of the acidic (pH<7) or basic characteristic (pH>7) of the system, and is controlled by dissolved chemical compounds and biochemical processes. In unpolluted surface waters, pH is principally controlled by the balance between carbon dioxide, carbonate, and bicarbonate (see “carbonate system,” below). Industrial effluents, atmospheric deposition, as well as photosynthesis and respiration of algae can affect the natural acid-base balance of aquatic systems (Water Quality Analysis, 1996). Changes in pH may have a strong effect on the toxicity of metals, ammonia, and nitrite. Typical surface waters have pH ranging from 6 to 9. The NCRWQCB Basin Plan objectives for pH are outlined in Table 3.8.
Alkalinity is the base neutralizing or “buffering” capacity of water (i.e., ability to neutralize acids). Total alkalinity is a measure of the net effect of all cations and anions; however, it is typically approximated by carbon dioxide (CO2(g) and CO2(aq)), carbonic acid (H2CO3), bicarbonate (HCO3), carbonate (CO3), and hydrogen ion (H+). These species make up the “carbonate system,” one of the most important acid-base relationships in aquatic systems.
(Tchobanoglous and Schroeder, 1987). Carbonate equilibrium can be represented as equation 3.1.
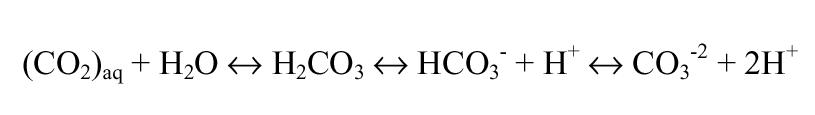
The quantity of any particular species is pH dependent: bicarbonate is the dominant species in surface waters (pH 6 to 9), while carbon dioxide and carbonate ion play increasingly important roles below pH 6 and above pH 9, respectively.
Alkalinity is expressed in a variety of units. Water quality engineers and treatment specialists typically report values in terms of calcium carbonate (mg CaCO3/l), while chemists report milliequivalents or moles per liter (meq/l or mmol/l). Occasionally values are reported in terms of bicarbonate (mg HCO3/l). Waters with low alkalinity are termed weakly buffered, and are susceptible to alterations in pH due to primary production (photosynthetic activity) as well as atmospheric acid deposition (acid rain). Calcium carbonate concentrations less than 75 mg/l are termed weakly buffered systems. Incidentally, acidity is the direct counterpart of alkalinity and is controlled mainly by strong mineral acids, weak acids such as carbonic acid, and strong acids. It is not as readily applicable as alkalinity and its use is somewhat qualitative (McCutcheon et al 1993).
Conductivity or specific conductance is a measure of the ability of water to conduct electric current. Conductivity can be used as a relative measure of general quality changes within a stream in space and/or time, in response to tributary, spring, or return flow accretion. It is sensitive to variations in dissolved solids, mostly mineral salts and the degree to which these dissociate into ions. The amount of electrical charge on each ion, ion mobility, and water temperature all have an influence on conductivity. Conductivity is related to concentration of total dissolved solids plus major ions and is expressed as microsiemens per centimeter. The conductivity of most waters ranges from 10 to 1000 µS cm-1 but may exceed 1000 µS cm-1 in polluted waters or those receiving large quantities of land runoff (Water Quality Assessments, 1996). The NCRWQCB Basin Plan objectives for specific conductance are outlined in Table 3.8.
Impact on Anadromous Salmonids: pH, Alkalinity, and Conductivity
The direct impacts of pH, alkalinty, and conductivity on anadromous salmonids are not well defined. However, indirect impacts of these parameters may be more profound. Krenkel and Novotney (1980) and EPA (1976) present a minimum alkalinity of 20 mg CACO3 /l to support cold water biota in freshwater aquatic systems.
Little information is available addressing salmonid tolerance to changes in pH, although effects of rainbow trout appear to show that pH levels between 5.0 and 9.0 are acceptable. The pH range that proved lethal within 24 hours to rainbow trout, roughly 10, was independent of acclimatization pH. Extended exposure to pH above 9 or below 5 may be harmful to rainbow trout (Colt et al 1979).
Though alkalinity has few if any direct impacts on anadromous fish, a weakly buffered system is predisposed to fluctuations in pH if sufficient primary production (algae) occurs (see Section 3.7 Algae, below). As noted previously, changes in pH can lead to increased toxicity of certain constituents/contaminants. Direct implications of conductivity on anadromous fishes are unknown.
References
Colt, J., S. Mitchell, G. Tchobanoglous, and A. Knight. 1979. The use and potential for aquatic species for wastewater treatment: Appendix B, the environmental requirements of fish. Publication No. 65, California State Water Resources Control Board, Sacramento, CA.
Davis, J.C. 1975. Minimal dissolved oxygen requirements of aquatic life with emphasis on Canadian species: a review. Journal of Fisheries Research Board Canada. 32(12), 2295-2332.
Deas, M.L. and G.T. Orlob. 1999. Klamath River Modeling Project. Project #96-HP-01. Assessment of Alternatives for Flow and Water Quality Control in the Klamath River below Iron Gate Dam. University of California Davis Center for Environmental and Water Resources Engineering. Report No. 99-04. Report 236 pp.
Krenkel, P.A. and V. Novotney. 1980. Water Quality Management. Academic Press, New York.
North Coast Regional Water Quality Control Board. 2001. Water Quality Control Plan for the North Coast Region. Staff report adopted by the North Coast Regional Water Quality Control Board on June 28, 2001. Santa Rosa, CA. 124 p. Appendix.
Water Quality Assessments. 1996. Water Quality assessments: A guide to the use of biota, sediments and water in environmental modeling. Ed. D. Chapman. Published on behalf of UNESCO United Nations Education, Scientific, and Cultural Organization; WHO World Health Organization; UNEP United Nations Environmental Programme. Chapman & Hall, London.