Bibliography Background About KRIS
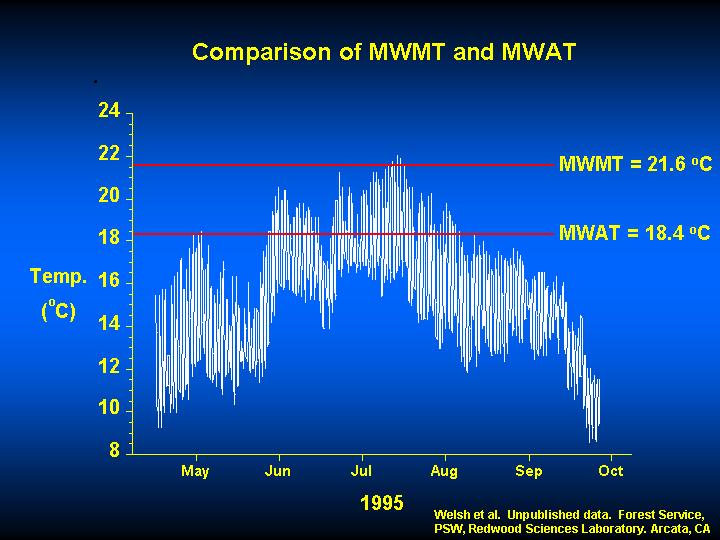
Comparison of MWAT and MWMT
This chart shows the hourly water temperature of a Mattole River tributary. The average daily mean temperature for each seven-day period was calculated and the maximum value for the year (MWAT) of 18.4 degrees C is displayed. The average daily maximum temperatures for each seven-day period was also calculated and the maximum for the season (MWMT) attained 21.6 degrees C. Data and graphic from Dr. Hartwell Welsh and Garth Hodgson, Redwood Sciences Lab, Arcata, CA.
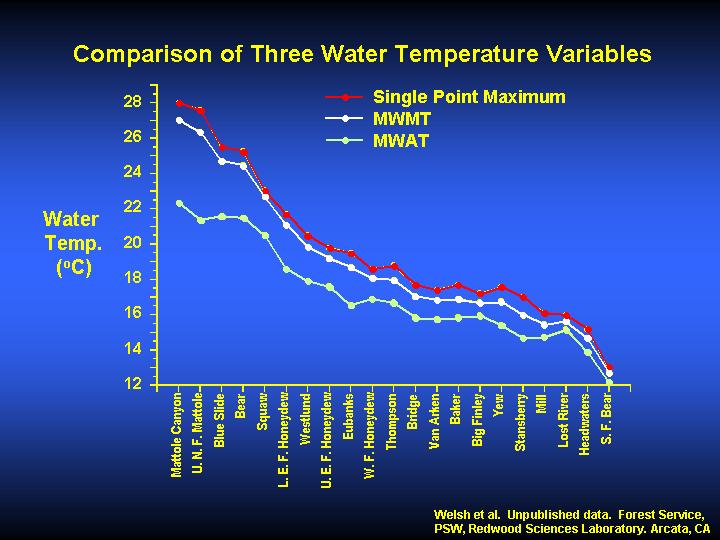
A comparison of three temperature variables
The comparison between maximum daily water temperature, maximum floating weekly maximum (MWMT) and maximum floating weekly average temperatures based on field data from the Mattole River is shown in this chart. The maximum of the floating weekly average (MWAT) can underestimate maximum temperatures by as much as 5 degrees C in warmer streams because the greater daily amplitude in these streams can pull the daily average down considerably. This modifying affect using MWAT makes the MWMT (maximum floating weekly average) a more biologically meaningful parameter that will better predict the ability of a given water body to support cold-water adapted species such as coho salmon or tailed frogs (Welsh & Hodgson, personal communication). Data and information from Dr. Hartwell Welsh and Garth Hodgson, Redwood Sciences Lab, Arcata, CA.